That naturally leads to the next question: how do we actually measure rootzone performance?
Most golf courses routinely submit soil samples for nutrient analysis. Those reports provide valuable information about pH, nutrient availability, cation exchange capacity and other chemical properties that help guide fertiliser and soil amendment programs. They answer the question, "What nutrients are available to the plant?"
Rootzone Performance Testing answers a completely different question. Rather than analysing nutrient availability, it examines how the rootzone functions as a physical growing medium. It measures the properties that determine how air and water move through the soil, how much moisture remains available after drainage, how stable the surface is under traffic, whether the profile conforms to recognised construction standards and how years of maintenance have gradually altered the original rootzone.
Although these two forms of testing are often discussed separately, they are complementary. A complete understanding of a putting green requires both. One explains the chemical environment surrounding the roots, while the other explains the physical environment those roots are trying to grow through while supporting a game of golf or other sports on top.
The distinction is important because many of the problems experienced on golf greens and other turf surfaces are not caused by nutrient deficiencies at all. They are caused by changes in the physical structure of the rootzone itself.
No Two Rootzones Perform the Same
Two greens may have identical fertiliser programs, receive the same irrigation, be maintained by the same staff and even be constructed using the same specification, yet one remains firm and consistent throughout the year while the other struggles after periods of rainfall or heavy play.
Water may be moving through one profile more slowly than expected. Air-filled pore space may have gradually reduced as organic matter accumulated near the surface. Years of topdressing may have changed the particle size distribution within the managed rootzone. Alternatively, the original construction sand may never have met the required physical standards in the first place.
In my experience, I rarely find two putting greens that continue to behave the same over time, even when they were constructed at the same time using the same specification. Small differences in maintenance history, traffic, shade and local growing conditions gradually compound, becoming significant over the life of a green.
None of these changes is immediately obvious from looking at the surface. Greens often continue to produce acceptable playing conditions while subtle changes occur beneath them. By the time symptoms become visible, the physical properties of the rootzone may already have changed significantly. This is where Rootzone Performance Testing provides value, allowing those changes to be measured before they become obvious during day-to-day maintenance.
The Foundation of Rootzone Performance
All putting greens are built from the same basic ingredients, yet the way those ingredients are combined determines how the surface performs for decades to come. The size, shape and arrangement of individual sand particles control the pore spaces between them, influencing how water drains, how much moisture is retained and how much oxygen reaches the roots.
Before looking at hydraulic conductivity, moisture retention or organic matter, it is important to understand the physical framework of the rootzone itself. Every other physical property measured during Rootzone Performance Testing is influenced by that framework, making Particle Size Distribution one of the most important tests performed on a putting green.
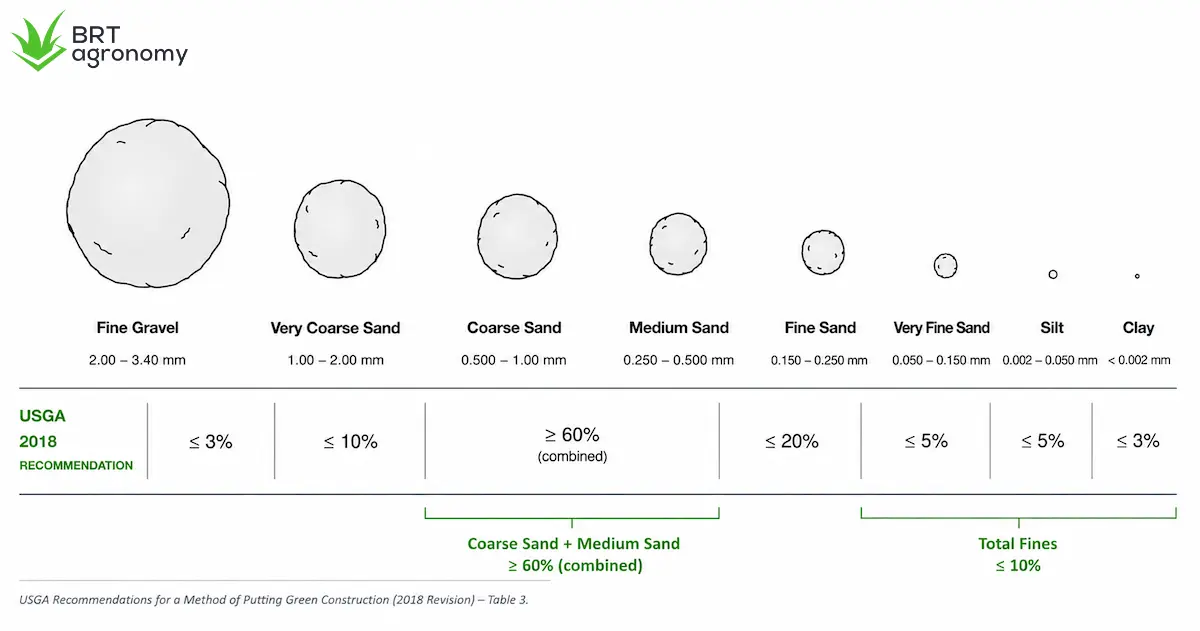
Measuring this requires a dried sample to be passed through a series of progressively finer laboratory sieves, allowing the percentage of particles within each size range to be measured. The results are then grouped into gravel, very coarse sand, coarse sand, medium sand, fine sand, very fine sand, silt and clay.
At first glance, it may appear to be little more than a description of the soil. In reality, it provides the foundation for understanding almost all other physical properties measured during Rootzone Performance Testing.
Particle size is one of the primary factors determining pore size. Large particles create larger pores, allowing water to move rapidly through the profile while also providing excellent oxygen exchange after drainage. Smaller particles fit more tightly together, producing smaller pores that retain water much more effectively but restrict drainage and reduce air movement.
Neither coarse nor fine particles are inherently better. Coarser sands generally improve drainage and oxygen exchange, while finer particles increase moisture retention. The objective is to achieve the balance required for consistent putting green performance rather than maximising either characteristic.
The USGA recommendations specify not only the acceptable percentage of each particle size fraction but also the relationship between them. Simply having the correct average particle size is not sufficient. The entire distribution must work together to produce the desired physical characteristics.
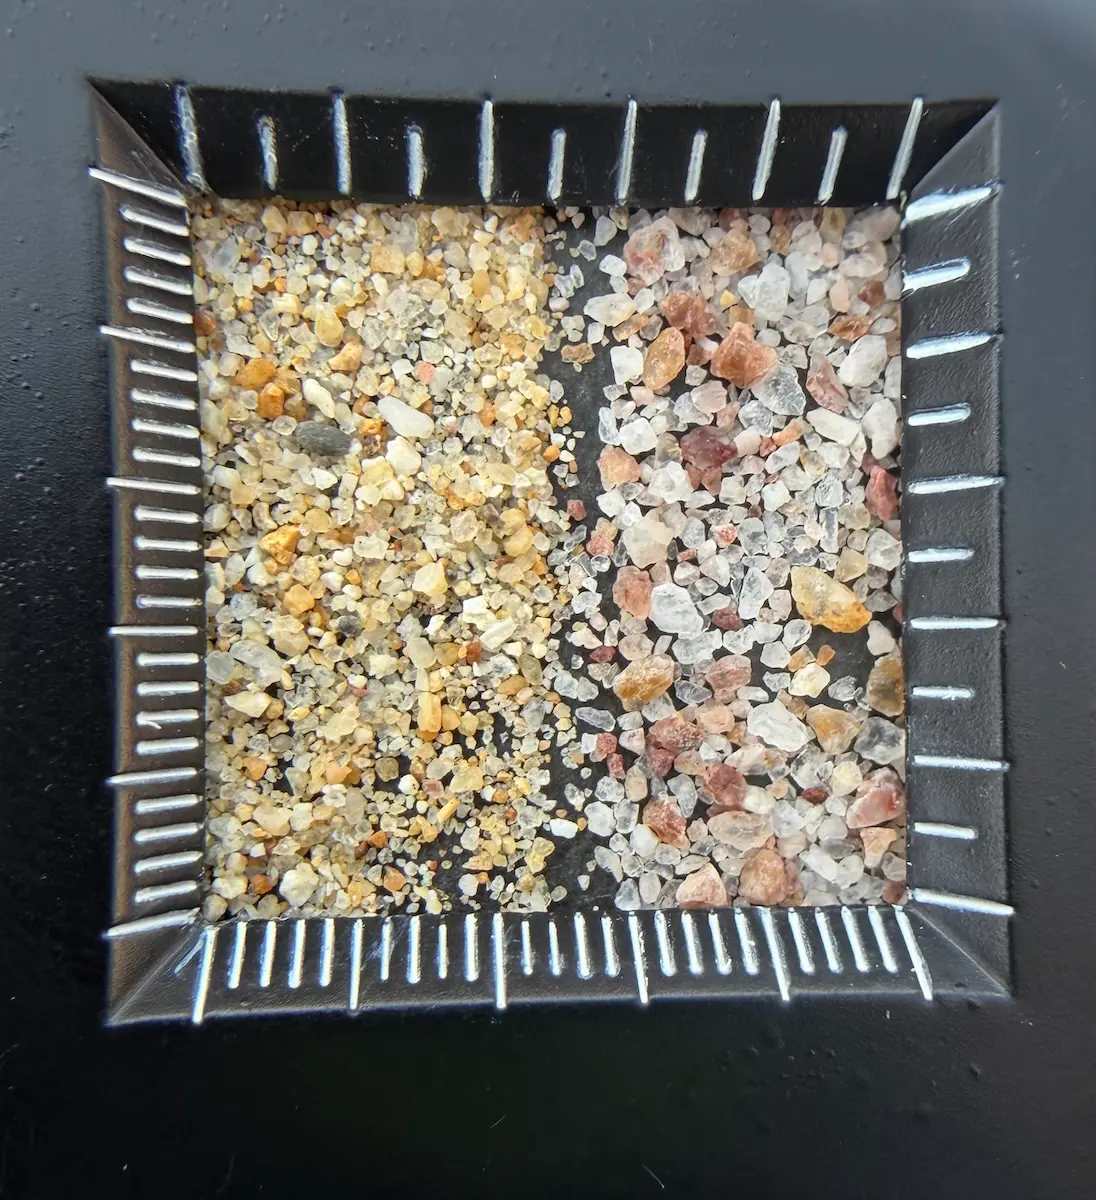
Particle size tells us how large the individual grains are. Particle Shape tells us how those grains fit together. A characteristic that is often overlooked, yet it has a major influence on surface stability.
Rounded particles behave much like marbles: rolling over one another easily, producing excellent drainage but relatively poor mechanical stability. Angular particles interlock with one another, increasing resistance to movement and creating a firmer and more stable surface, while still maintaining adequate pore space when the particle size distribution has been selected correctly.
Neither extreme is desirable. Excessively rounded sands may produce soft surfaces that shift under traffic and require greater reliance on organic matter accumulation to provide stability. Extremely angular materials may interlock so tightly that pore continuity begins to decline, reducing water movement through the profile.
Particle shape therefore cannot be considered independently from particle size distribution. Together they determine how the mineral framework of the rootzone is assembled.
One of the more misunderstood measurements reported during physical testing is the Coefficient of Uniformity, often abbreviated to CU. Although the calculation itself is relatively straightforward, its importance is frequently underestimated.
CU describes how similar the sand particles are in size. A very low CU indicates that most particles are almost identical in diameter. It sounds desirable; uniform materials are often associated with consistency and precision. However, the opposite is often true when constructing putting greens.
If every particle is virtually the same size, they struggle to pack efficiently together. The result is a rootzone with large interconnected pores, excellent drainage and high air-filled porosity, but often poor surface stability. This is one of the reasons early USGA putting greens occasionally developed soft surfaces despite meeting many of the recommended particle size specifications.
Introducing a broader range of particle sizes allows smaller grains to occupy some of the spaces between larger particles, increasing packing efficiency and producing a firmer, more stable rootzone — a characteristic seen in some of the world's most famous sand profiles on the Melbourne Sandbelt.
The challenge is finding the correct balance. If the range becomes too broad, the smaller particles begin filling excessive pore space, reducing infiltration and restricting oxygen movement.
The USGA recommendations therefore specify an acceptable range for Coefficient of Uniformity rather than simply encouraging the highest or lowest possible value. Like all other physical properties, the objective is balance rather than extremes.
Bulk Density measures the mass of dry soil contained within a known volume, providing an indication of how tightly the particles are packed together. While it is often discussed as an indicator of compaction, its real value is understanding how much pore space remains available for water, air and root growth.
Like most physical properties, bulk density has no universally "good" value. A profile with very low bulk density may contain abundant pore space but lack stability, while excessively high bulk density may restrict root development and reduce infiltration. Interpreted alongside porosity, hydraulic conductivity and particle size distribution, it provides another piece of the overall picture rather than an answer on its own.
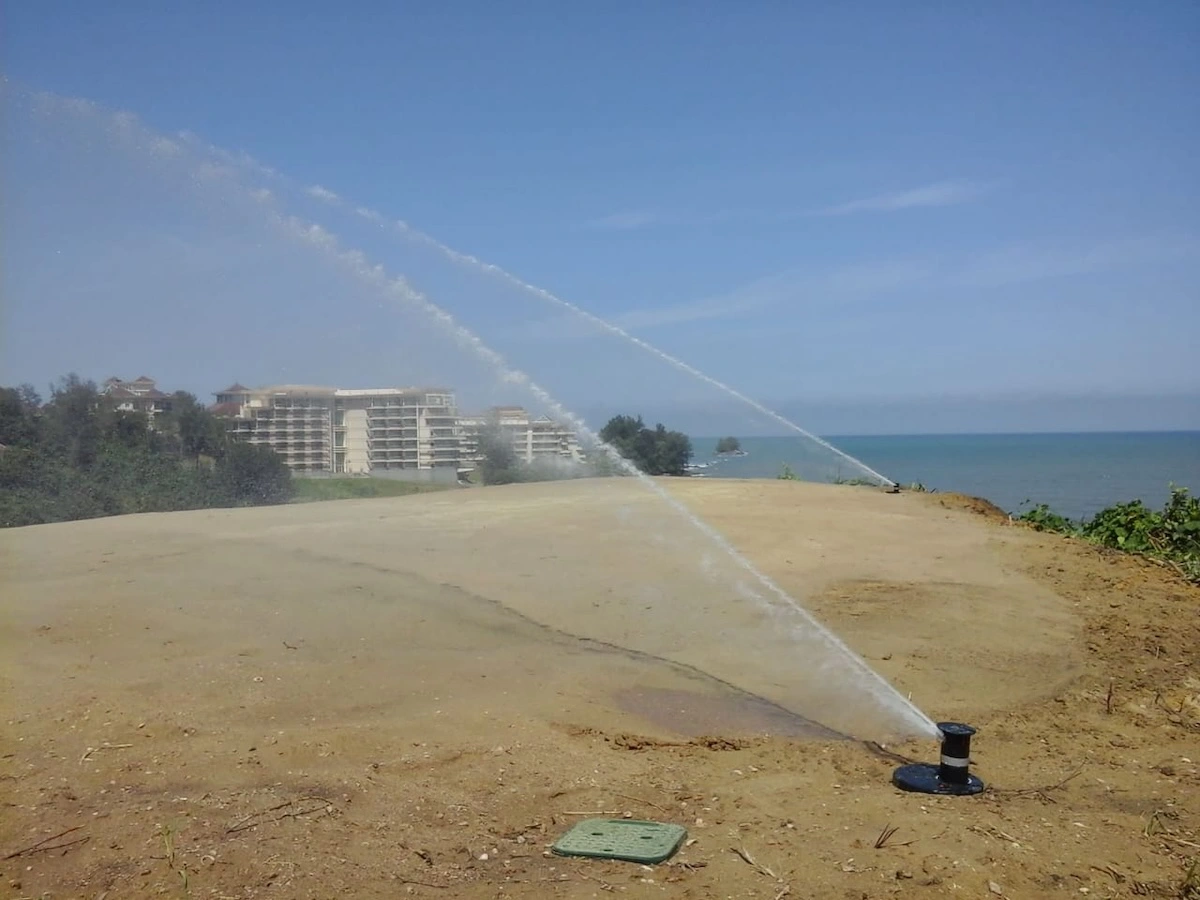
How Water Moves Through a Rootzone
Once the mineral framework of the rootzone has been understood, attention turns to the spaces between those particles. These spaces are collectively known as pore space. Although invisible to the naked eye, pore space is arguably the most important component of any putting green.
Roots do not grow through solid sand particles, water does not move through mineral grains and air is not stored within quartz. Everything required for healthy turf growth exists within the pore spaces between them.
For this reason, Rootzone Performance Testing measures three related properties:
- Total porosity
- Air-filled porosity
- Capillary porosity
Each describes a different aspect of how the profile functions after irrigation or rainfall. Rather than competing with one another, they work together to determine whether the rootzone can simultaneously provide adequate drainage, sufficient oxygen and an appropriate reserve of plant-available water.
Following rainfall or irrigation, the smaller capillary pores retain water for plant use while the larger pores drain freely and become occupied by air. Measuring both allows us to determine whether the rootzone is maintaining the balance between water availability and oxygen availability required for healthy turf growth.
The balance is far more important than either value alone. A rootzone containing very high capillary porosity may retain large quantities of water, but if that comes at the expense of air-filled porosity, roots begin growing in an increasingly oxygen-deficient environment. Likewise, a profile with exceptionally high air-filled porosity may drain rapidly and provide abundant oxygen, yet struggle to retain enough water for consistent turf performance.
One of the biggest misconceptions in golf course management is that drainage and moisture retention are opposing characteristics. In reality, well-performing rootzones achieve both remarkably well. They remove excess water quickly following rainfall while retaining sufficient plant-available water to support healthy turf between irrigation cycles.
If there is one physical property that golf course managers are most familiar with, it is probably drainage. After heavy rainfall, everyone notices which greens drain quickly, which pool with water on the surface and which remain saturated for several days. The laboratory equivalent of that observation is Saturated Hydraulic Conductivity, often abbreviated to Ks.
Hydraulic conductivity measures the rate at which water moves through a completely saturated rootzone and is fundamental to understanding performance because each period of saturation temporarily displaces oxygen from the pore spaces. The longer water remains within the profile, the longer roots remain under reduced oxygen conditions.
Poor hydraulic conductivity therefore influences much more than surface playability. It affects root health, microbial activity, nutrient cycling, disease pressure and recovery to playable conditions following rainfall. However, hydraulic conductivity is also one of the most misunderstood measurements in physical testing because higher is often assumed to be better. It often isn't.
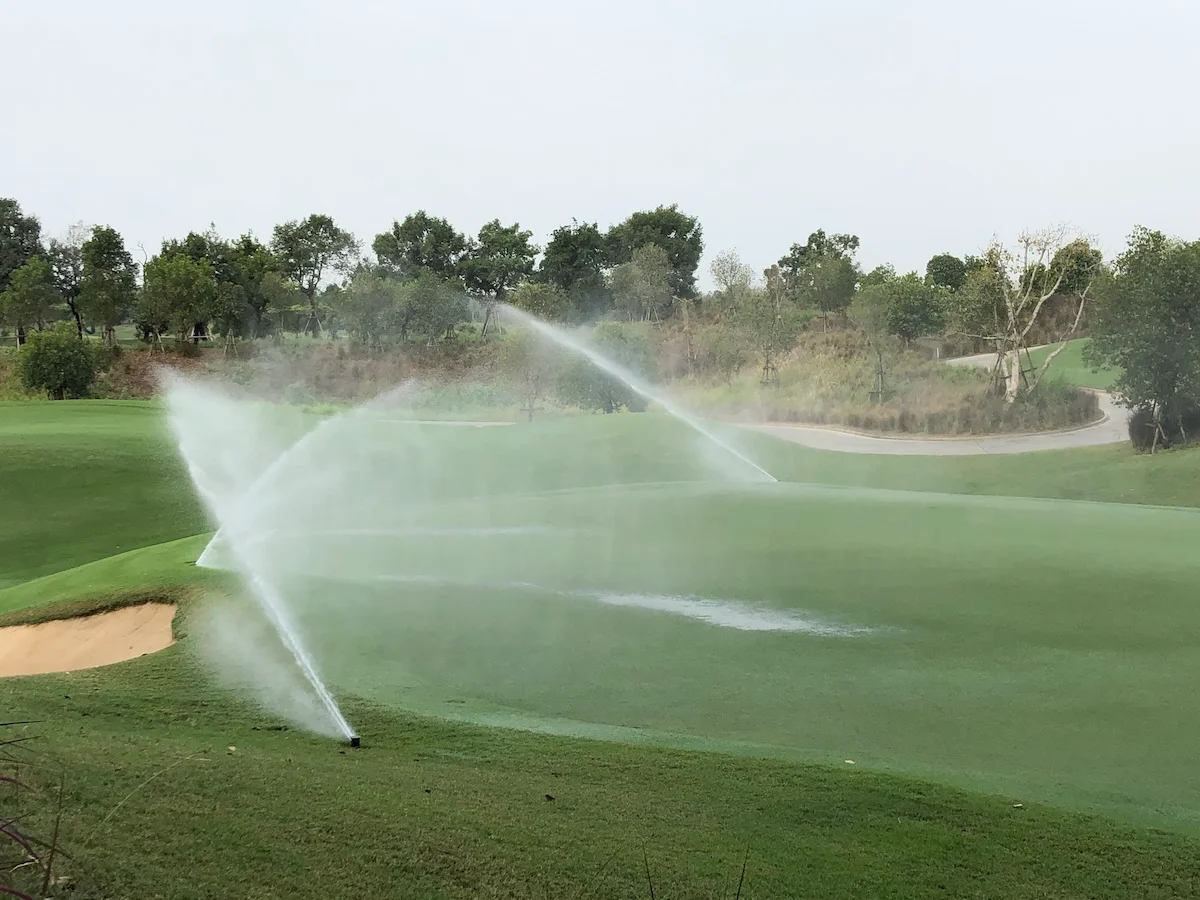
A rootzone capable of draining several metres of water per hour may sound impressive, but if it cannot retain adequate plant-available water, irrigation frequency increases dramatically and moisture management becomes increasingly difficult.
Conversely, a profile with extremely low hydraulic conductivity may retain moisture very effectively, but prolonged saturation following rainfall increases the likelihood of shallow rooting, black layer development and disease.
Over the years I've encountered rootzones at both extremes. Some have drained so rapidly that greens required multiple irrigation cycles each day simply to avoid wilt and localised dry patch. Others have been so slow to infiltrate that sprinklers could only run for a couple of minutes before water began pooling on the surface. Neither represents a well-balanced rootzone.
Like every other physical property discussed so far, hydraulic conductivity must be interpreted alongside the rest of the system. It is only one piece of the puzzle.
A Moisture Release Curve Analysis takes the next step beyond simply measuring how much water a rootzone contains. It examines how tightly that water is held within the profile and, more importantly, how readily it can be used by the plant.
As a rootzone dries, the largest pores empty first while progressively smaller pores continue holding water. Measuring this process at different tensions, or simulated profile depths (typically 10cm, 20cm, 30cm and 40cm), produces a moisture release curve, providing a much clearer understanding of how quickly the profile drains, how much plant-available water it stores and how moisture changes between irrigation events, each at varying profile depths.
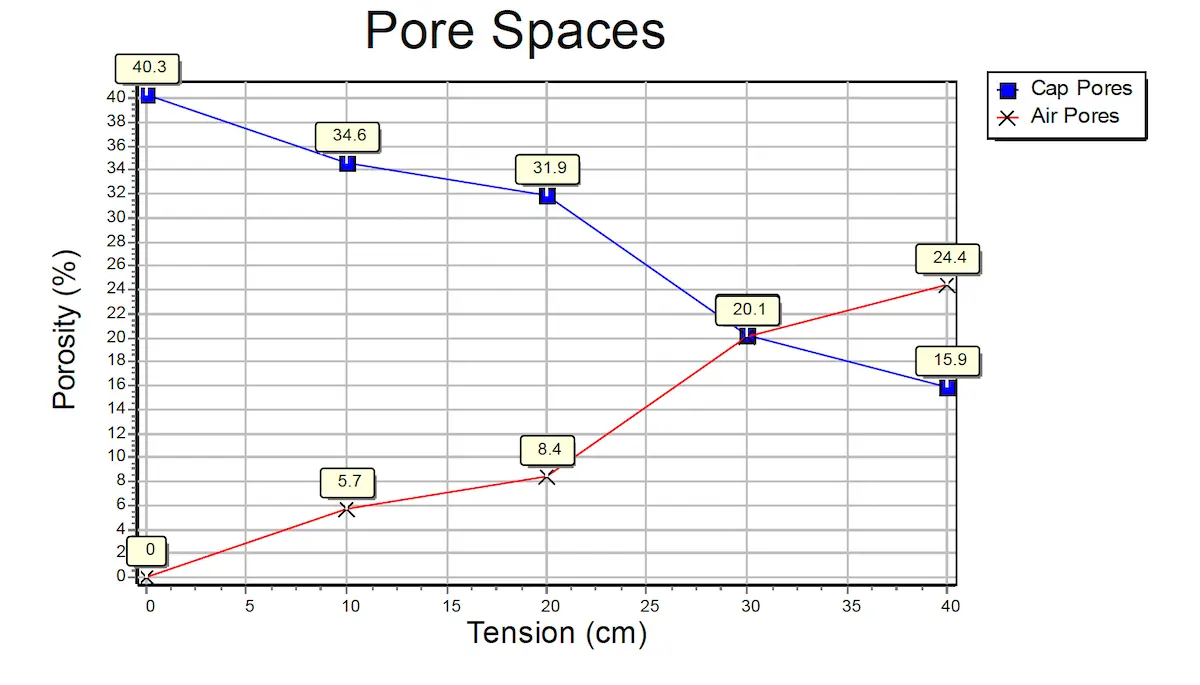
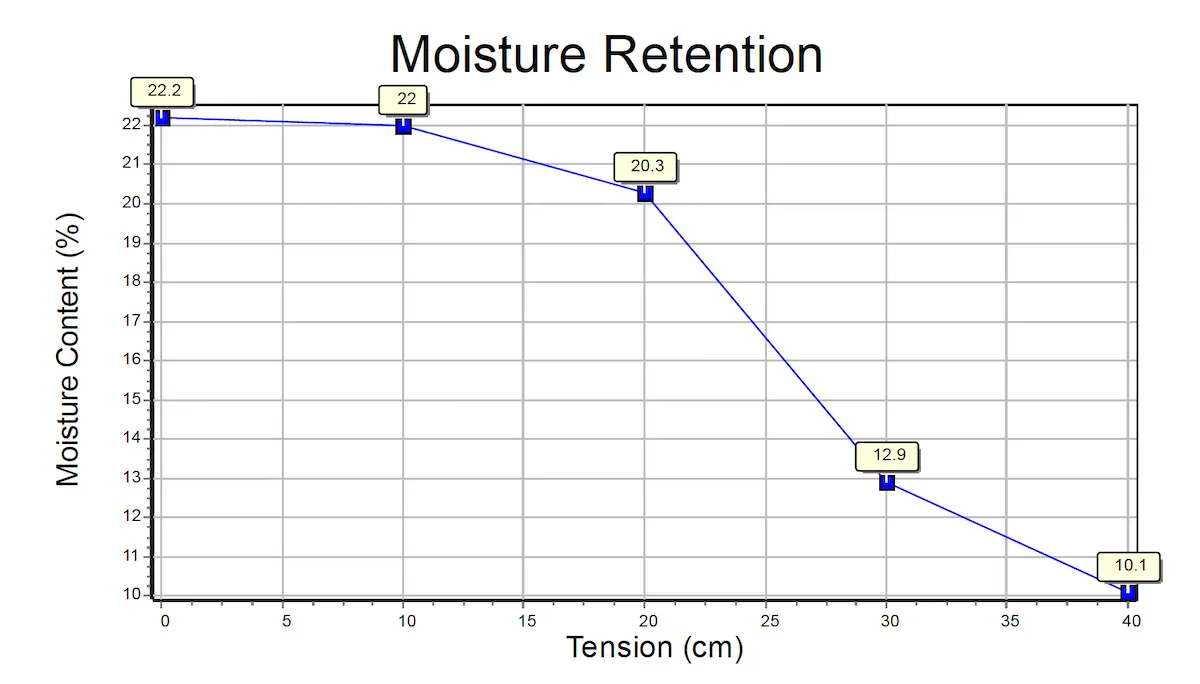
Two rootzones may contain the same volumetric moisture content immediately after rainfall yet behave very differently over the following days or hours because that water is being held within different pore sizes and under different tension. A Moisture Release Curve Analysis helps explain those differences and helps turf managers and agronomists make more informed decisions around choosing the best sand for construction and topdressing.
This is one of the reasons why selecting a sand based solely on particle size distribution can be misleading. Two sands may satisfy the same specification yet behave quite differently once they're installed on a golf course.
Initially, the remaining water is readily available to the plant. As drying continues, however, the remaining water becomes increasingly difficult for roots to extract because it is held more tightly within progressively smaller pores. Eventually, the plant reaches the point where it can no longer overcome these forces. Water is still present within the profile, but the turf simply cannot access it. The distinction is important because a rootzone can contain relatively large amounts of water while still placing the plant under moisture stress.
Moisture Release Curve Analysis allows us to understand the moisture retention for a chosen sand, at a select profile depth, at field capacity after the free water has drained away. For golf course managers increasingly adopting precision irrigation and soil moisture monitoring, this information provides valuable context when establishing operational moisture targets.
When Should Moisture Curve Analysis be Used?
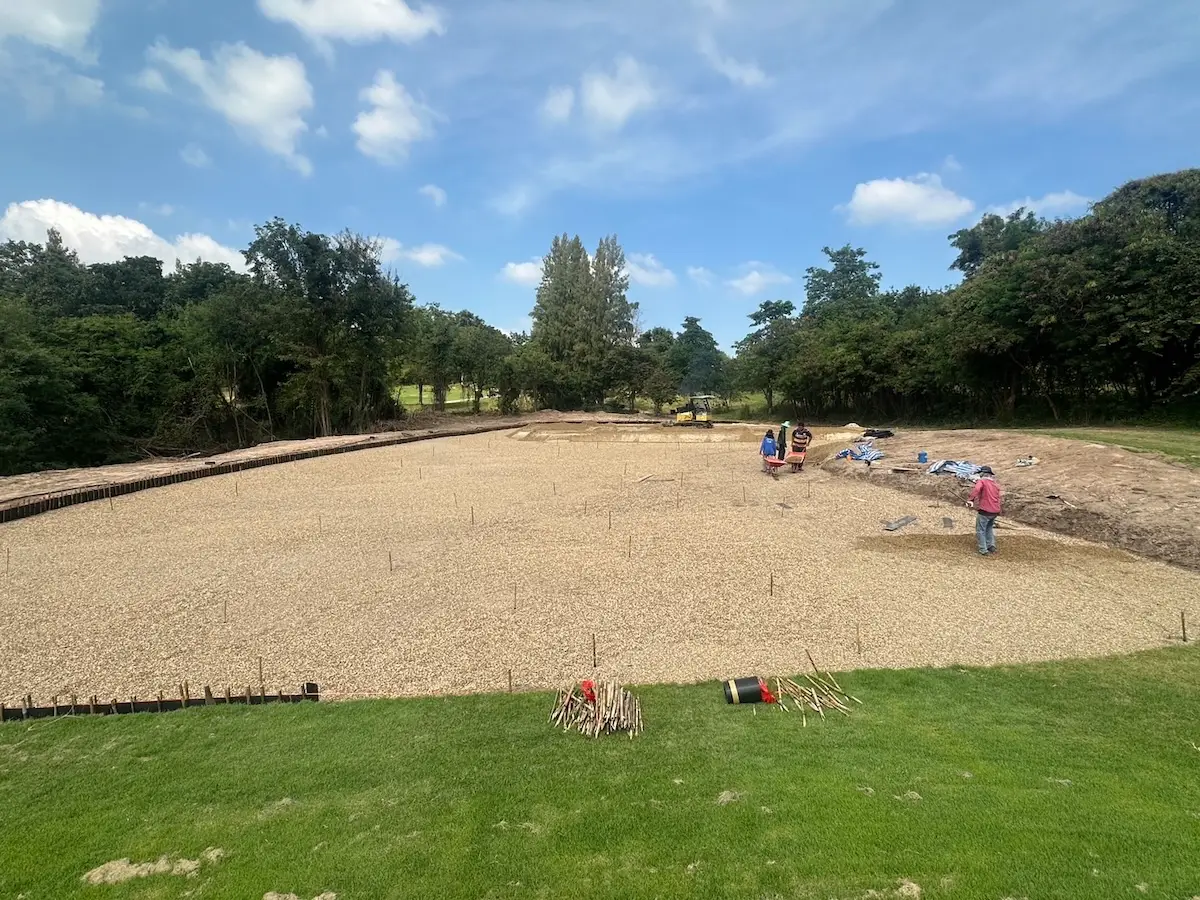
This is also an appropriate point to clarify one of the most common misunderstandings surrounding Moisture Release Curve Analysis. Although it is an extremely valuable test, it is not designed primarily for evaluating mature putting greens that have accumulated years of organic matter. Its greatest value lies during construction, reconstruction and material selection.
When testing a proposed construction sand or topdressing material, the moisture curve describes the inherent physical characteristics of that material. Because organic matter has not yet significantly altered the profile, the results provide an accurate representation of how that sand is likely to perform once installed.
The same applies when evaluating laboratory rootzone blends or comparing potential topdressing materials before they are introduced into a maintenance program.
Established putting greens present a different challenge. Years of cultivation, topdressing, root growth and organic matter accumulation gradually alter the physical characteristics of the upper profile, meaning the moisture release curve no longer represents the original construction material alone. Instead, it reflects the behaviour of the managed rootzone that has evolved through years of maintenance.
Understanding the distinction is important when deciding which physical tests are most appropriate for different situations.
Measuring How a Rootzone Evolves
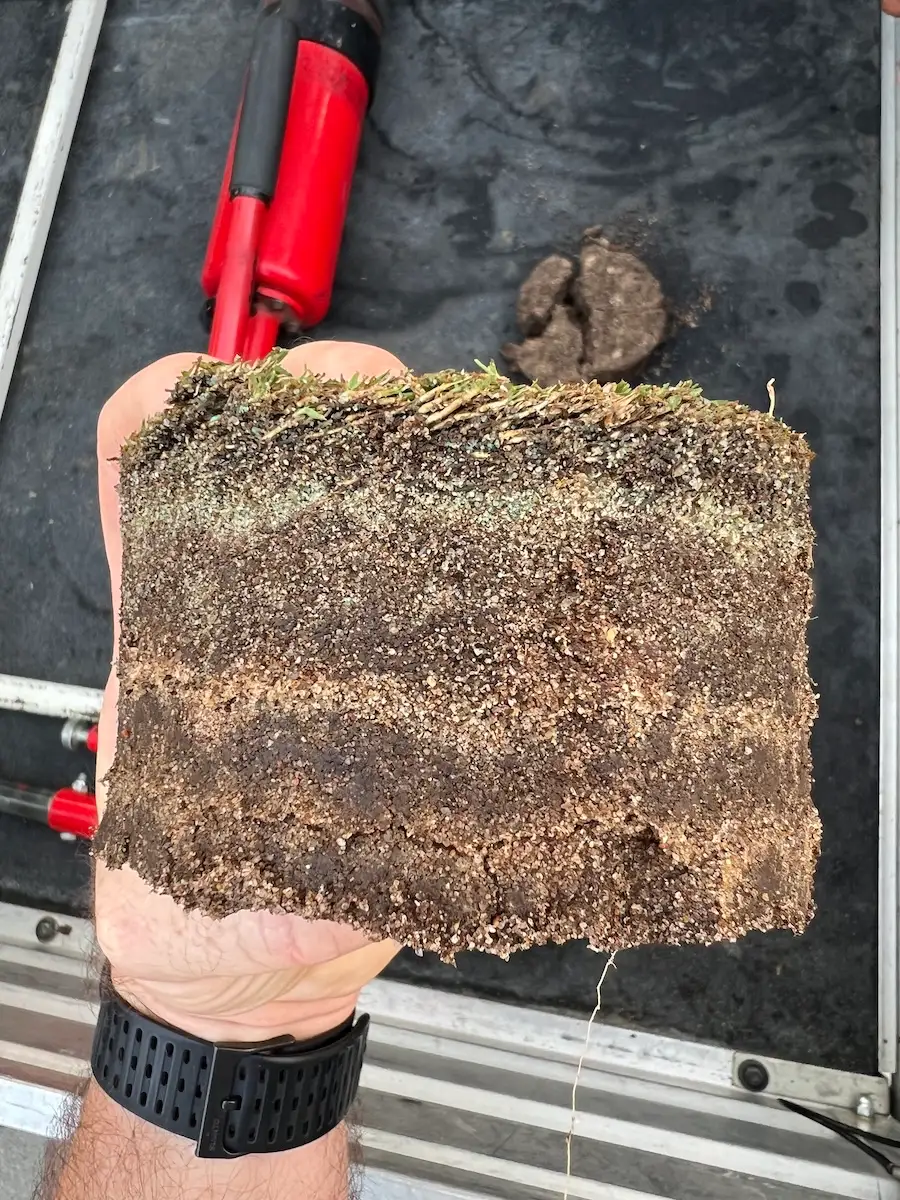
One of the themes throughout this series has been that every putting green changes. The original construction profile is only the beginning, and from the day the green opens for play, every aeration program, every topdressing application, every root produced by the turf and every gram of organic matter returned to the soil begins altering the physical characteristics of the upper profile.
Some of these changes are beneficial. Others gradually reduce rootzone performance. The challenge is that they occur so slowly they often go unnoticed.
Most golf courses only recognise the problem after surface performance has already begun to decline. This is where Rootzone Performance Testing becomes much more than a construction quality control exercise. It becomes a tool for measuring how the managed rootzone evolves over time.
OM246 is perhaps the most familiar example of measuring this change. However, I believe it tells only part of the story. Understanding how much organic material has accumulated is important. Understanding how the mineral structure beneath the surface changes over time provides another level of insight.
This is where pairing OM246 with post-burn sand fraction analysis becomes particularly powerful.
OM246 Total Organic Material
Few physical properties influence putting green performance more than organic matter accumulation. As it builds within the upper profile, infiltration slows, moisture retention increases, air-filled pore space declines and surfaces often become softer. These changes occur gradually over many years, making them difficult to detect through visual observation alone. OM246 allows that change to be measured objectively rather than estimated.
Unlike the traditional organic matter test commonly included in soil nutrient analyses, the OM246 method measures the total organic material in the sample, including living roots, stolons, rhizomes, crowns, and decomposed organic matter. Providing a much more representative assessment of the material influencing rootzone performance.
That distinction is important because all these components influence how the rootzone performs. Equally important is where the organic material is located in the profile.
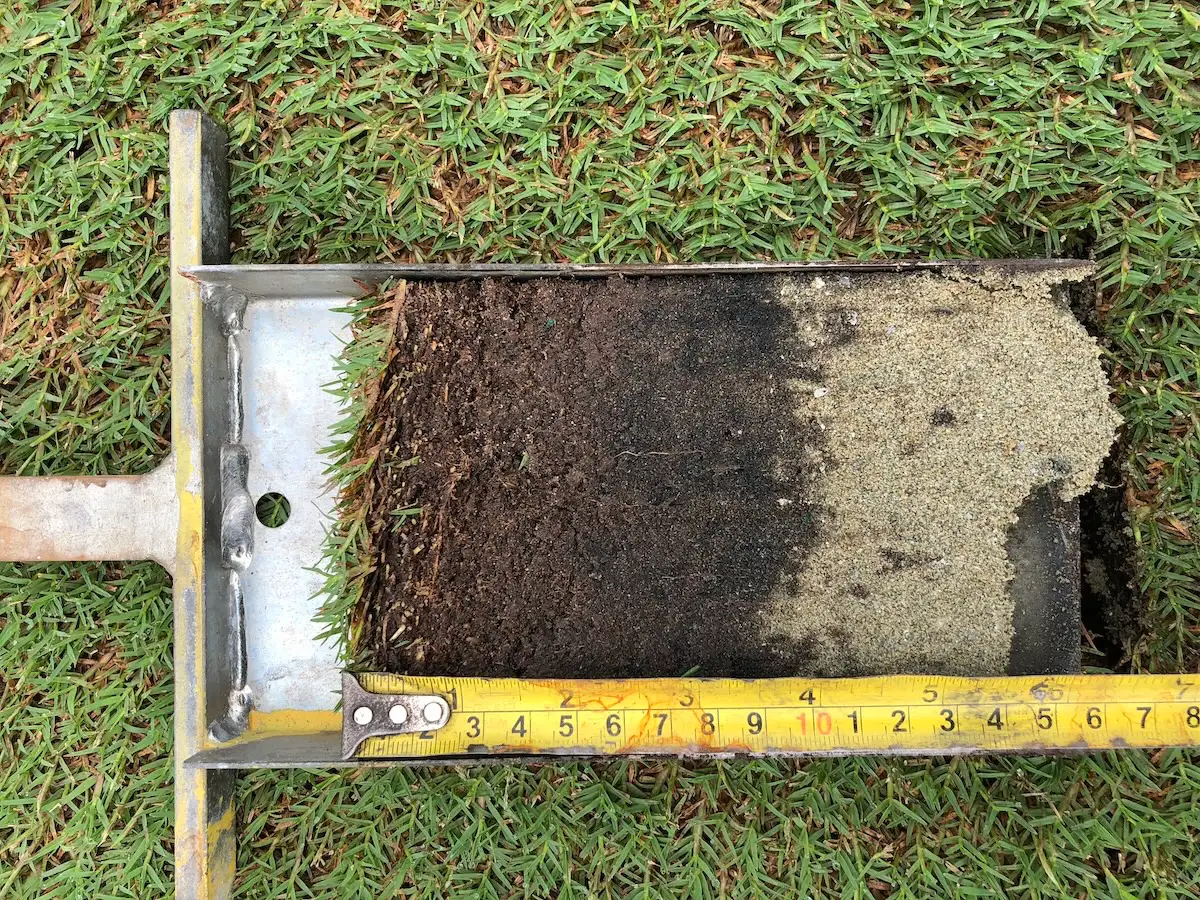
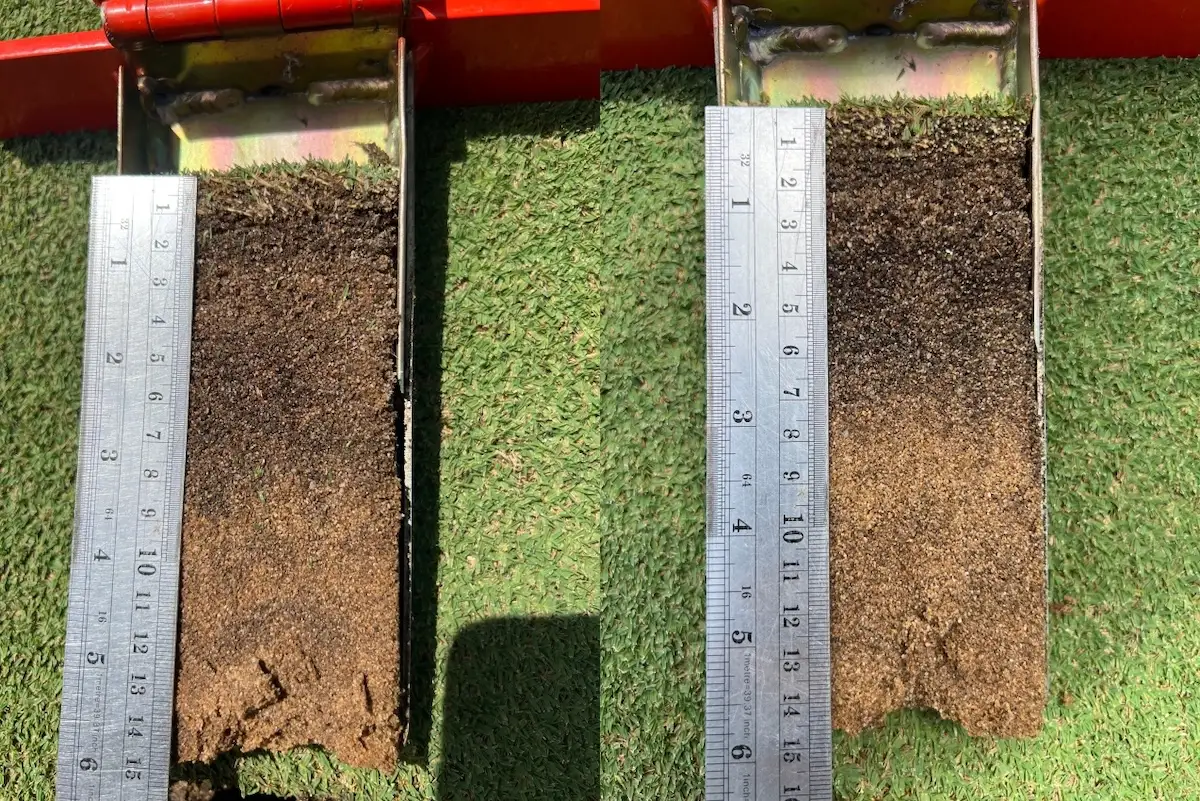
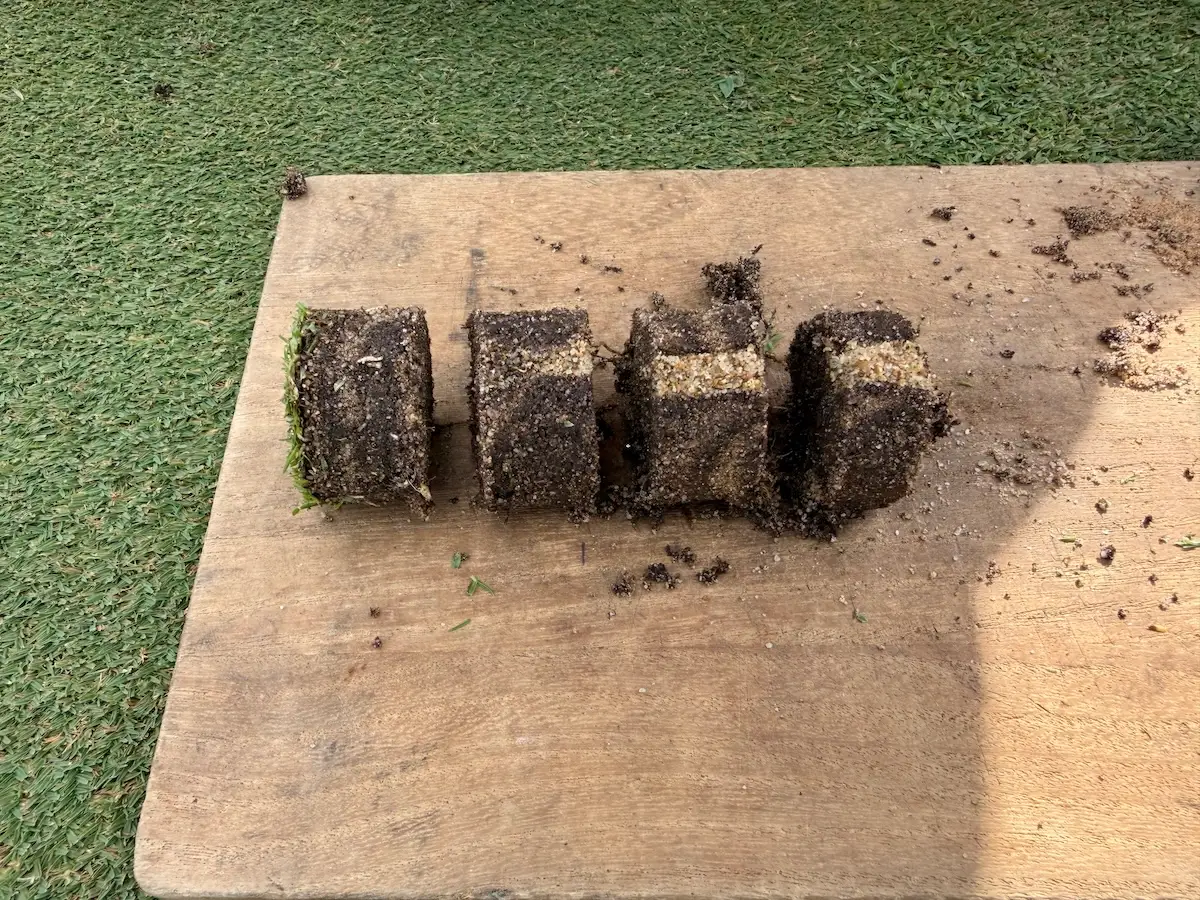
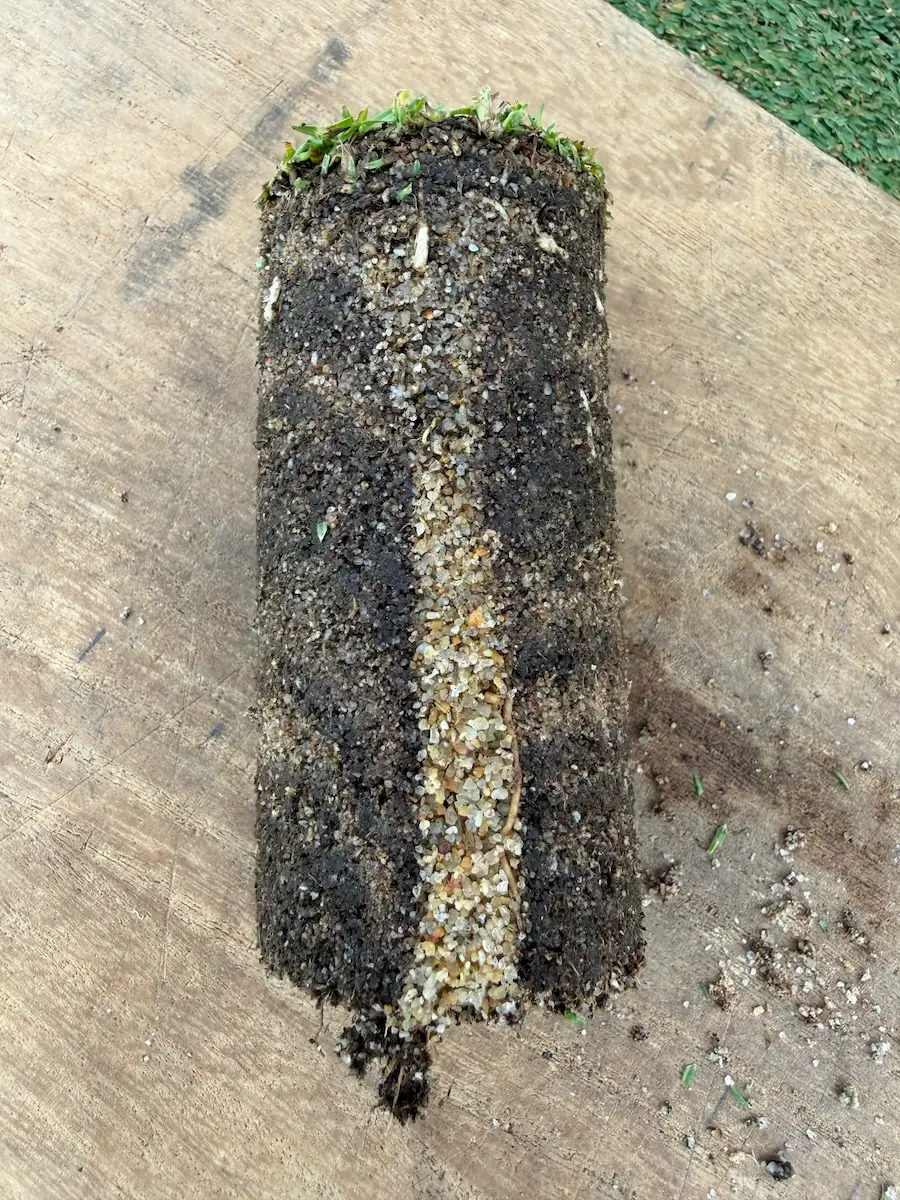
Organic matter does not accumulate uniformly throughout the profile. On putting greens and other turf surfaces, most accumulation occurs within the upper rootzone, near the surface, where roots are continually growing and decomposing, organic residues are returned to the soil and repeated topdressing and cultivation are modifying the surface. Measuring the entire profile as a single sample can therefore mask important changes occurring close to the surface.
One observation that continues to surprise me is how often a single organic matter result is treated as though it represents the entire profile. In reality, the upper 20mm (0.78 inches) often tells a very different story from the rootzone beneath it, particularly with some of the new super Bent and Ultradwarf Bermuda/Couch turf varieties available now.
This is why OM246 testing is typically performed at multiple depth intervals. Separating the upper managed rootzone into 4 sections: 0-2cm (0.78in), 2-4cm, 4-6cm and 0-6cm (2.36in) provides a much clearer understanding of where accumulation is occurring, how rapidly it is changing and whether current maintenance practices are moving the profile towards or away from the desired performance targets.
Perhaps most importantly, changes can be monitored over time. One result provides a snapshot, and repeated testing begins telling the story.
Beyond OM246
Although OM246 has transformed the way we measure organic matter accumulation, I believe it becomes even more valuable when paired with another analysis that receives far less attention: Post-Burn Sand Fraction Analysis.
OM246 tells us how much organic material has accumulated within the profile. What it doesn't tell us is how years of topdressing, cultivation and organic matter accumulation have altered the mineral framework of the managed rootzone.
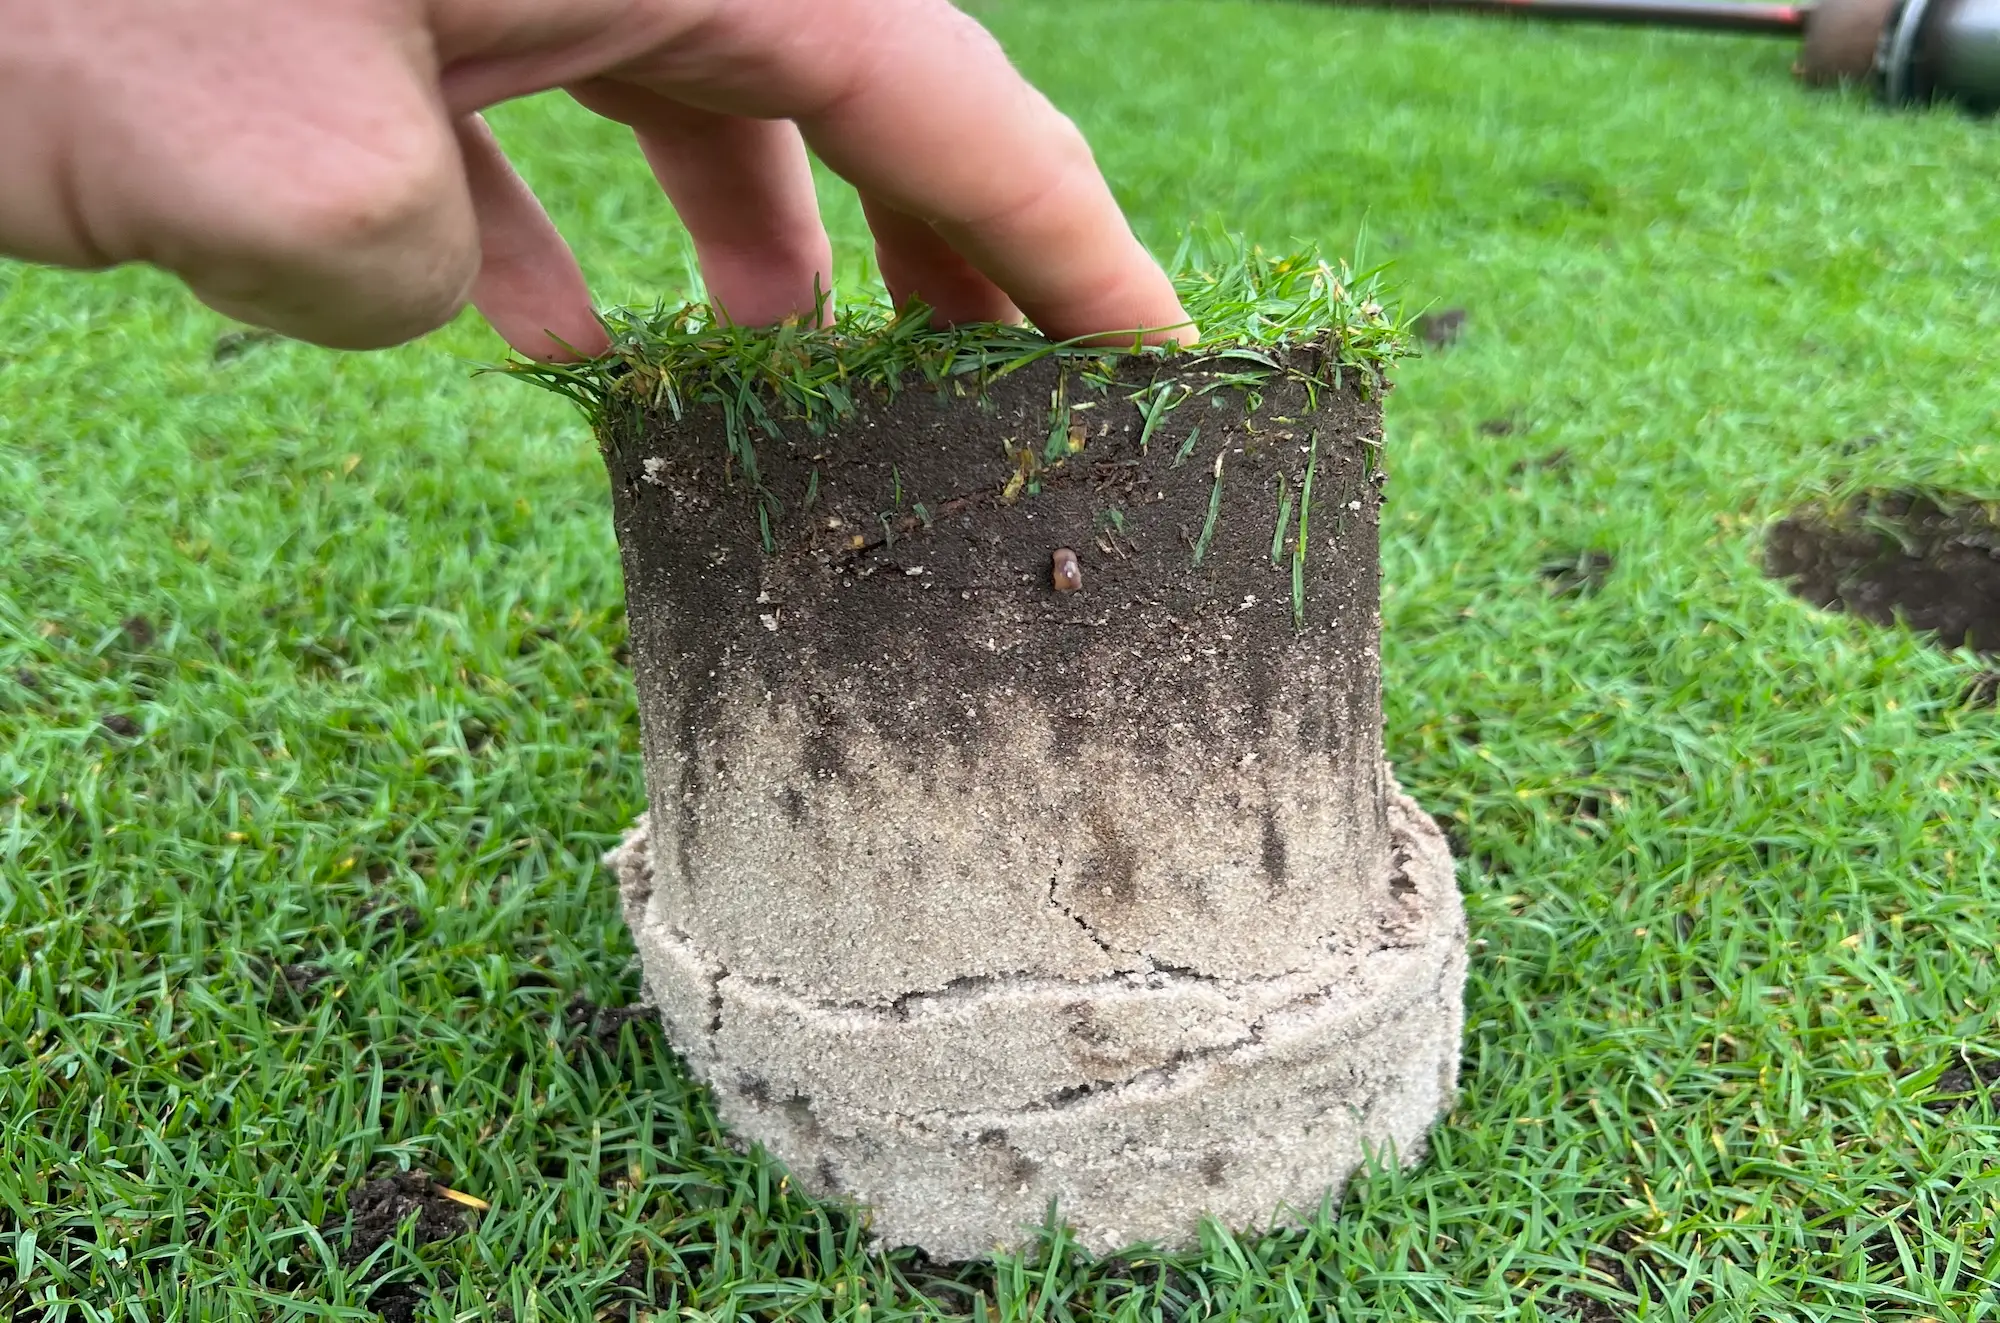
All mature putting greens effectively contain two rootzones. The first is the original construction profile installed when the green was built. The second is the managed rootzone that gradually develops through years of maintenance. While the construction profile beneath changes relatively little, the managed rootzone is continually evolving.
Understanding that evolution requires us to look beyond organic matter alone.
Separating Organic Matter from the Mineral Framework
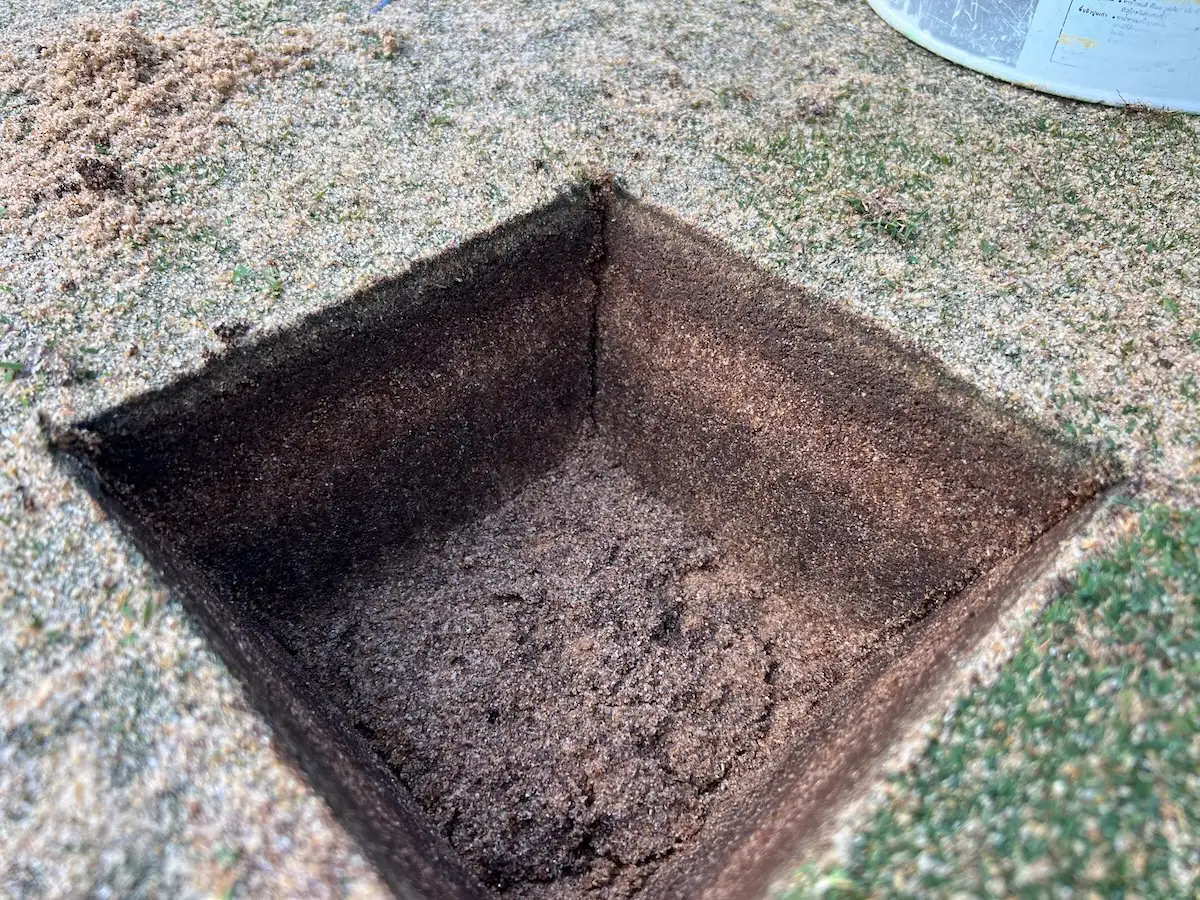
Particle size analysis has traditionally been used to evaluate the original construction sand or a proposed topdressing material. Both are important, particularly when constructing a putting green or assessing whether a new topdressing sand is compatible with the existing profile. What is rarely measured, however, is the sand within the managed rootzone itself.
Over time, the upper profile evolves through repeated topdressing, cultivation, root growth and organic matter accumulation. Although the original construction sand remains beneath it, the managed rootzone gradually develops its own physical characteristics. Most of us simply assume this upper layer closely resembles the topdressing sand being applied, but that isn't usually the case.
In my experience, that assumption is rarely questioned because the managed rootzone is rarely analysed directly. Yet after years of maintenance, it is often the managed rootzone, not the original construction sand, that determines how the surface performs.
This concept has been explored further by PACE Turf, who compared the particle size distribution of topdressing sands with the sand fractions remaining in the upper managed rootzone following OM246 testing. Their results clearly demonstrate that the managed rootzone often differs significantly from the topdressing material being applied, reinforcing the importance of measuring the profile itself rather than relying on assumptions.
An important consideration is that the particle size distribution within the managed rootzone is rarely identical to either the original construction sand or the current topdressing material. During mowing, larger sand particles attached to leaf tissue and organic material are continually removed from the surface, while repeated topdressing introduces new material. Over many years, these small changes gradually alter the relative proportions of the various sand fractions, creating a managed rootzone with its own unique physical characteristics.
Once the OM246 test has quantified the total organic material, the remaining mineral material can be passed through a standard particle size analysis. Rather than analysing the original construction sand or a fresh topdressing sample, we are now examining the mineral framework of the managed rootzone itself with the organic material removed, allowing a completely different set of questions to be explored.
- Have years of topdressing gradually shifted the particle size distribution within the upper profile?
- Does the managed rootzone still resemble the original construction sand?
- Is it becoming more representative of the current topdressing material, or have cultivation and organic matter accumulation created something different altogether?
These are important questions for golf courses seeking to better understand how the managed rootzone is changing over time and how those changes may be influencing long-term performance.
Why OM246 and Post-Burn Sand Fractions Work Together
OM246 measures how much organic material has accumulated within the managed rootzone. Post-burn sand fraction analysis complements it by characterising the mineral framework that remains once that organic material has been removed.
Together, the two tests provide a much more complete understanding of how the managed rootzone is evolving. The results can be compared with the original construction sand, the current topdressing material and previous post-burn analyses to determine how the upper profile is changing over time and whether those changes are influencing rootzone performance.
For established putting greens, I believe OM246 and post-burn sand fractions should be viewed as companion tests rather than independent analyses. One measures how much the managed rootzone has changed, while the other helps explain how its mineral framework has evolved. Together they provide an insight into the managed rootzone that simply isn't available through conventional testing alone.
Topdressing Compatibility
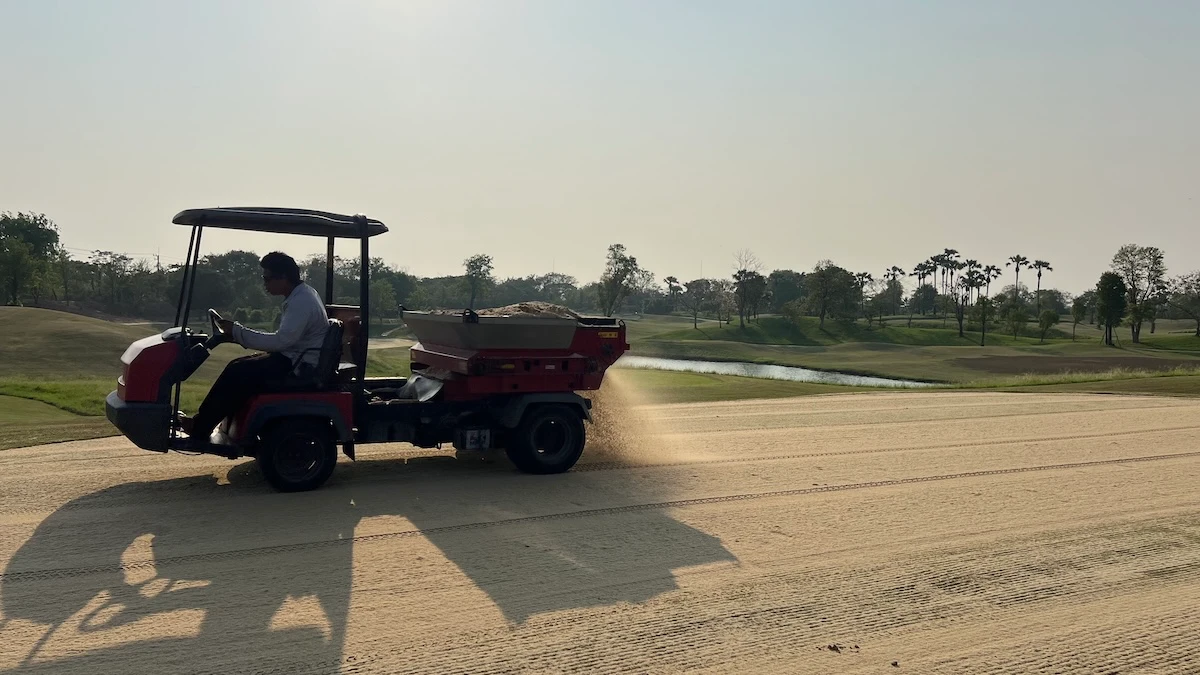
Topdressing is one of the most powerful tools available for managing rootzone performance. Each application contributes new mineral material to the managed rootzone. Over time, those repeated applications gradually influence particle size distribution, surface stability, infiltration characteristics and moisture behaviour. For this reason, selecting a topdressing sand should never be based solely on availability, colour or cost.
Physical compatibility with the existing rootzone is equally important. Introducing a sand with substantially different particle size characteristics can gradually create layering within the profile or alter the physical behaviour of the managed rootzone in unintended ways. Depending on the objective, these changes may be beneficial or detrimental.
Compatibility testing allows proposed topdressing materials to be compared with the existing rootzone before they are introduced into the maintenance program.
The objective is not necessarily to find an identical sand. In many situations, deliberately selecting a material with slightly different characteristics may help move the managed rootzone towards the desired performance targets. The important point is that compatibility is verified rather than assumed.
Once incorporated into the profile, each topdressing application becomes part of the managed rootzone. Selecting compatible materials therefore isn't simply about avoiding problems today; it's about deliberately shaping how the rootzone will perform years into the future.
Understanding USGA Recommendations
The United States Golf Association has spent decades refining its recommendations for putting green construction, and those recommendations remain the most widely recognised benchmark for sand-based rootzones throughout the world.
One of the most common misconceptions, however, is what it actually means for a rootzone to be described as "USGA specification."
Many people assume that if the particle size distribution falls within the published recommendations, the material qualifies as a USGA rootzone. That is not the case.
Particle size distribution is only one component of the specification. A true USGA specification rootzone must satisfy the complete suite of recommended physical criteria. Particle size distribution, saturated hydraulic conductivity, total porosity, air-filled porosity, capillary porosity, bulk density, coefficient of uniformity and the relationships between these properties all contribute to overall compliance.
The recommendations are designed as an integrated system where each parameter supports the others, rather than a collection of independent targets. The distinction is important because it reinforces one of the central themes of Rootzone Performance Testing.
A rootzone with excellent hydraulic conductivity but inadequate moisture retention is unlikely to perform as intended. Likewise, a profile with ideal particle size distribution may still fail to achieve the desired performance if its pore space characteristics or CU fall outside the recommended ranges.
That is exactly why comprehensive physical testing is required.
Interpreting the Results as a System
One of the biggest mistakes that can be made with Rootzone Performance Testing is viewing each laboratory result in isolation. It is understandable why this happens.
Laboratory reports are usually presented as tables of numbers. Hydraulic conductivity occupies one row, bulk density another, porosity another and particle size distribution another. The temptation is to assess each result individually, deciding whether it is "good" or "bad" before moving on to the next. That is not how rootzones work.
Each physical property influences another. Increasing organic matter may improve moisture retention while simultaneously reducing air-filled porosity and infiltration, while altering particle size distribution can affect surface stability, hydraulic conductivity and moisture dynamics.
Changing topdressing sand may gradually influence porosity, firmness and moisture dynamics over many years.
No individual result should ever be interpreted without considering the rest of the system. This is one of the reasons Rootzone Performance Testing differs so significantly from many routine laboratory analyses. The purpose is not simply to compare numbers against a reference table. It is to understand how those measurements interact to explain the behaviour being observed on the golf course.
A superintendent may describe a green as soft after rainfall, inconsistent during dry weather or difficult to maintain within a desired moisture range. Those observations are often symptoms of multiple physical characteristics working together rather than a single measurement sitting outside an acceptable range.
The laboratory results simply provide the evidence needed to explain why those symptoms are occurring.
Supporting Field Observations with Data
Rootzone Performance Testing should never replace field observations; it should strengthen them.
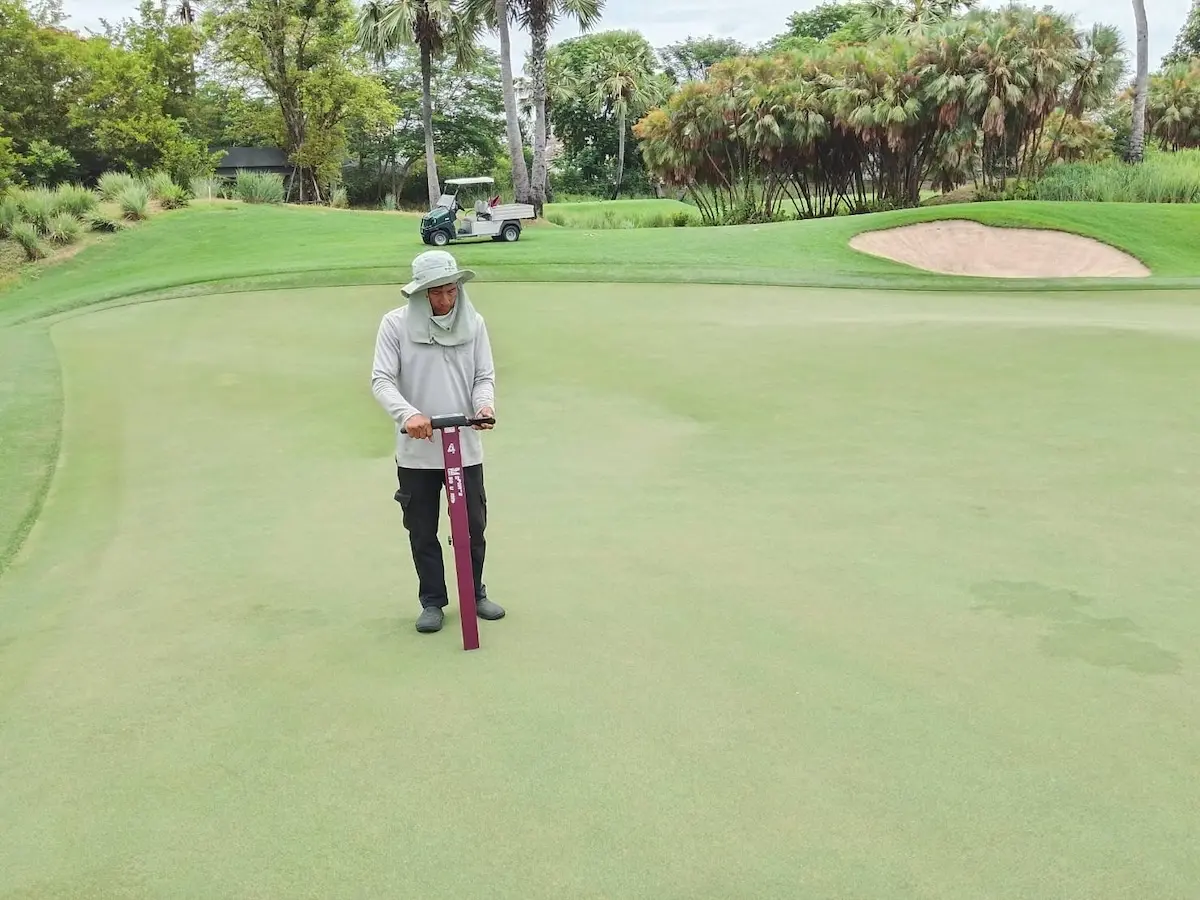
Over time, every superintendent develops an understanding of how their greens behave throughout the year. They know which surfaces drain first after heavy rainfall, which greens become hydrophobic during summer and which areas remain wet despite receiving similar maintenance practices. Those observations are incredibly valuable.
Many of the golf courses I visit already know which greens are causing problems. The laboratory doesn't identify those greens — it helps explain why they're behaving differently and gives us objective information to guide the solution.
In practice, Rootzone Performance Testing should answer the questions that observations alone cannot. Why does one green remain wet while another dries quickly? Why has infiltration declined despite regular aeration? Why does one area consistently require more hand watering than another?
By combining field observations with objective measurements, management decisions become evidence-based rather than assumption-based. The laboratory doesn't replace experience; it explains it.
Defining Performance Targets
Whether documented or not, every golf course operates to a set of performance targets. Green speed, firmness, smoothness and moisture are monitored routinely because they influence the golfer's experience. The same approach can be applied below the surface.
Rather than chasing generic laboratory recommendations, Rootzone Performance Testing allows golf courses to establish physical targets based on the conditions that consistently produce their preferred playing surfaces.
One course may perform best with an OM246 value of 3.5% in the upper 20mm (0.78in), while another may function equally well closer to 5.5%. The correct target depends on the grass species, climate, construction method and maintenance objectives.
Once those targets have been established, physical testing becomes more than a diagnostic exercise. It becomes a way of monitoring whether the rootzone is moving towards or away from the desired performance.
From Reactive Maintenance to Proactive Management
Perhaps the greatest value of Rootzone Performance Testing is that it changes the conversation.
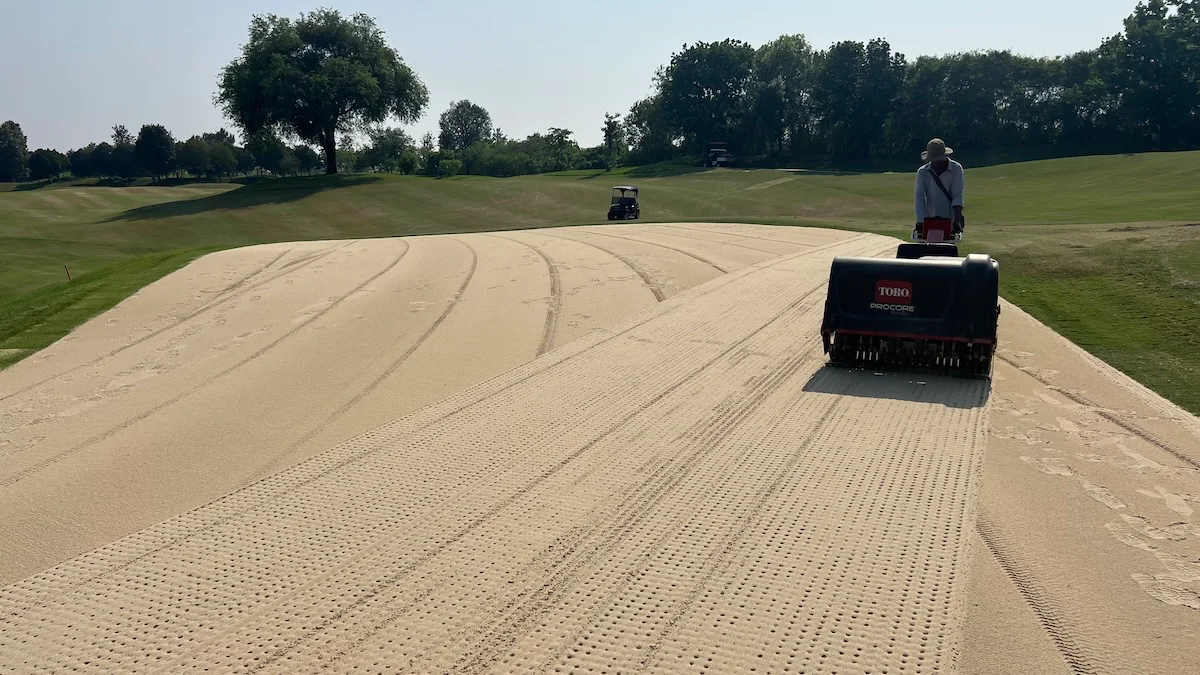
Rather than reacting to poor infiltration, excessive softness or declining root health after they become visible, physical testing allows maintenance teams to identify gradual changes and trends long before they begin affecting surface performance.
Organic matter accumulation can be monitored before infiltration declines, changes in the managed rootzone can be measured before undesirable layering develops, and topdressing compatibility can be assessed before thousands of tonnes of sand have been applied. These changes usually occur so gradually that they often go unnoticed until symptoms begin appearing at the surface. I've experienced this myself, where declining infiltration only became obvious once water started pooling after rainfall. Looking back, the warning signs had been developing long before they became visible.
As a result, maintenance practices become preventative rather than corrective, allowing the rootzone to be managed strategically rather than simply responding to declining performance.
Experience remains an essential part of that process. Rootzone Performance Testing doesn't replace observation or practical knowledge; it provides another layer of evidence to support better-informed decisions.
Final Thoughts
Rootzone Performance Testing isn't about collecting more laboratory data. It's about understanding why one green performs differently from another, measuring how the profile changes over time and making better management decisions before declining performance becomes visible at the surface.
The more rootzone profiles I interpret, the more convinced I become that understanding how the managed rootzone evolves is one of the most overlooked aspects of modern turf management.
All putting greens continually evolve. Organic matter accumulates, cultivation modifies the upper profile, and years of topdressing gradually create what I refer to as the managed rootzone.
The golf courses that consistently produce high-quality putting surfaces aren't necessarily those carrying out the most maintenance. More often, they're the ones that understand how their rootzones behave, monitor how they change over time and use objective measurements to guide long-term decisions.
Ultimately, that's what Rootzone Performance Testing is designed to do: not produce more laboratory reports, but provide better information for better decision-making.