Once the laboratory results come back, the next question is what to actually do with them. This is where I think testing can sometimes become unnecessarily complicated. It is easy to become focused on whether an individual result is high, low or sitting within a recognised range without first considering whether that result helps explain what is happening on the golf course.
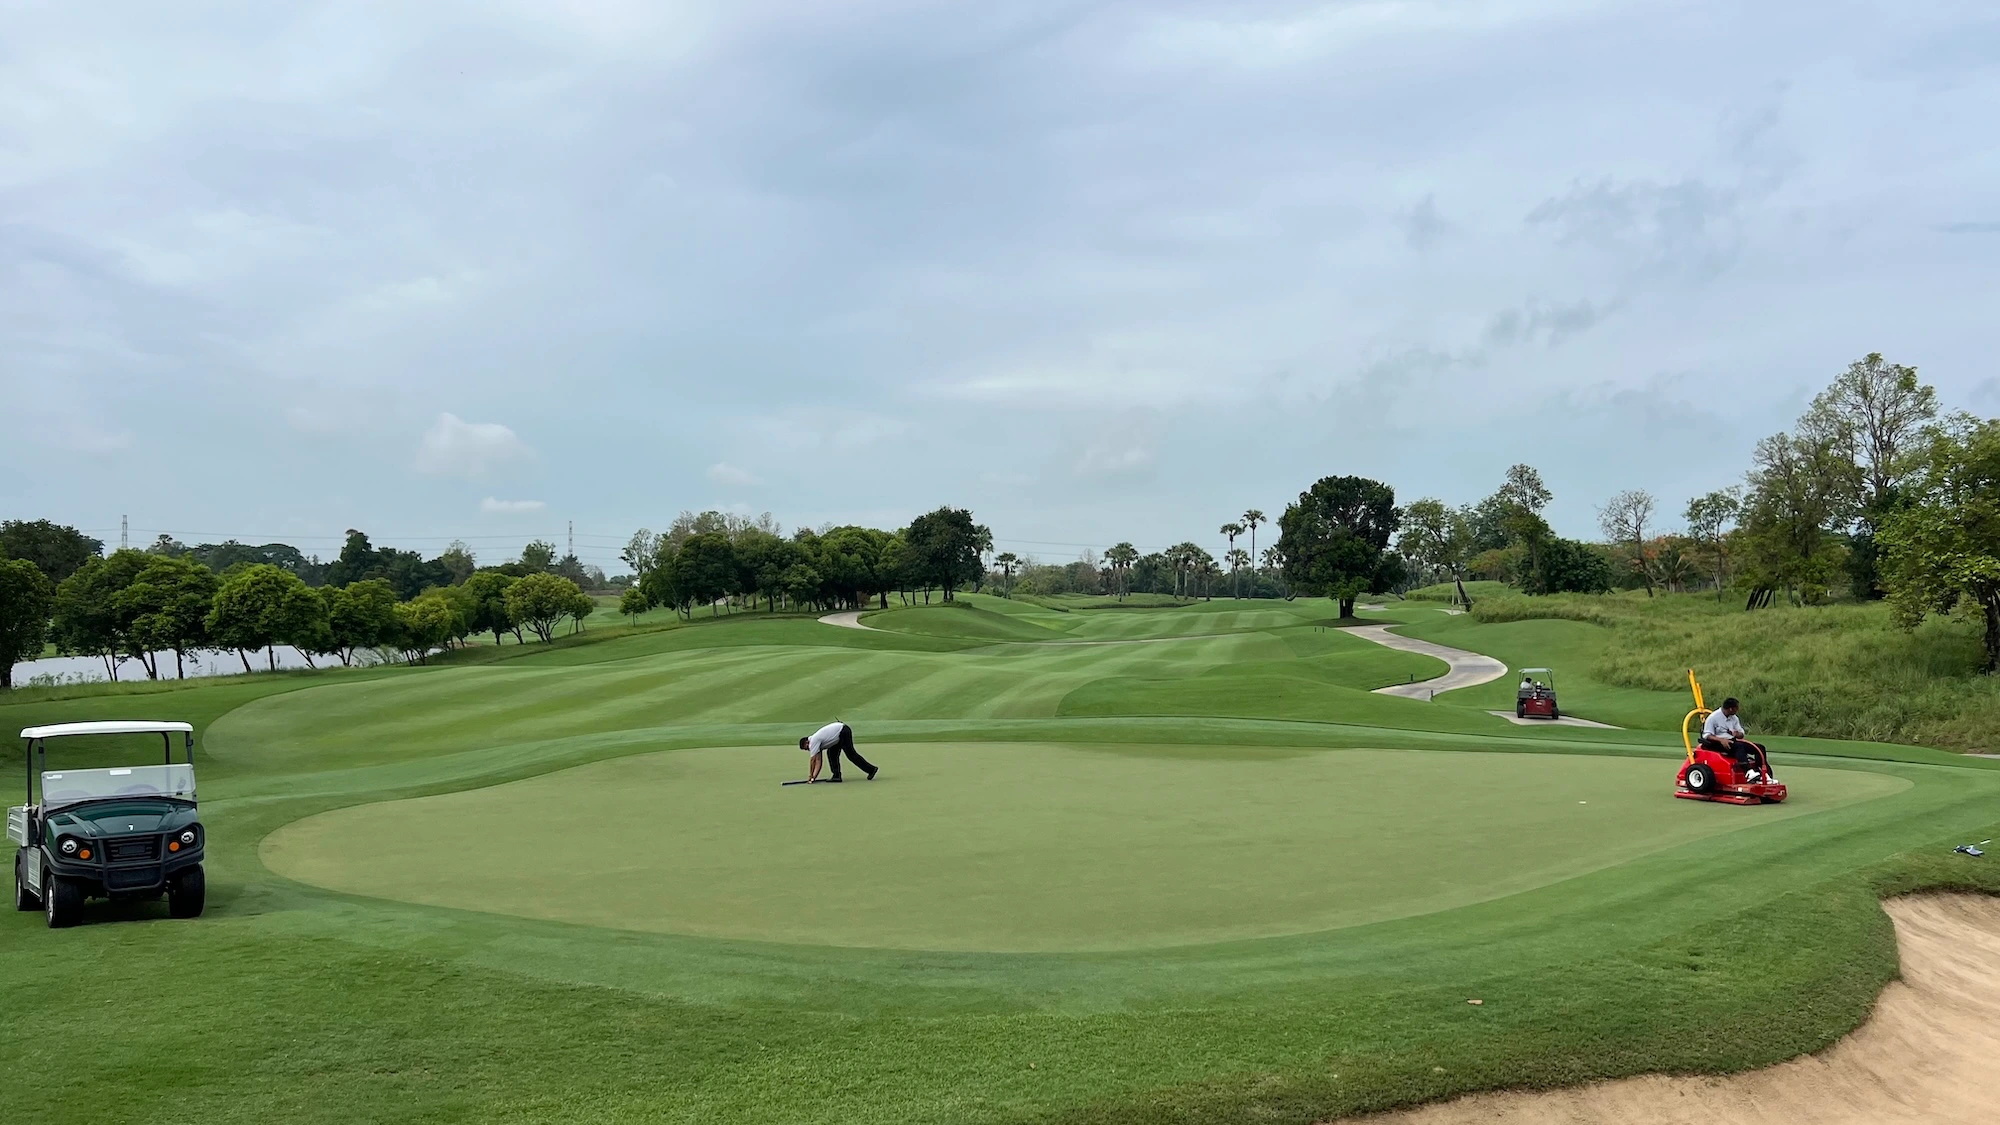
I prefer to start with what we are seeing in the field. Perhaps the greens are remaining soft for too long after rainfall, drying excessively during the day or becoming inconsistent between different areas. There may also be no obvious problem at all and the testing is simply being used to establish a baseline and monitor how the rootzone is changing over time.
The laboratory results should then help us understand why the rootzone is behaving the way it is. A result sitting outside a benchmark may be important, but it does not automatically mean the maintenance programme needs to change. The objective is not to produce a laboratory report where every number looks ideal. It is to develop and maintain a rootzone that consistently produces the turf health and playing conditions required by that particular facility.
Start With What the Green Is Telling You
One of the easiest mistakes to make when reviewing rootzone testing is to work backwards from an individual number. If organic matter is high, the immediate response may be to increase cultivation. If hydraulic conductivity is low, the assumption may be that drainage needs to be improved. In many cases, those conclusions may eventually prove correct, but there needs to be a connection between the test result and the performance we are seeing in the field.
This is also where benchmarks need to be used carefully. Comparing results against a meaningful dataset can tell us whether a particular characteristic is unusual and can help establish an appropriate target range, but the benchmark itself should not become the objective. A golf course with high-performing greens in one climate, grass species or construction type may have very different physical characteristics from another course producing equally good playing conditions somewhere else.
The more useful approach is to consider the field observations first, then use the various test results together to explain what is happening. The following examples are all situations where this process led to very different management decisions.
When the Construction Rootzone Is Part of the Problem
A few years ago, I worked with a golf course in temperate Australia with Bentgrass greens that had been reconstructed approximately five years earlier. The intention during construction was to create very firm putting surfaces similar to those found on many Melbourne Sandbelt golf courses, and a rootzone sand containing a relatively high percentage of fine particles had been selected to help achieve that stability.
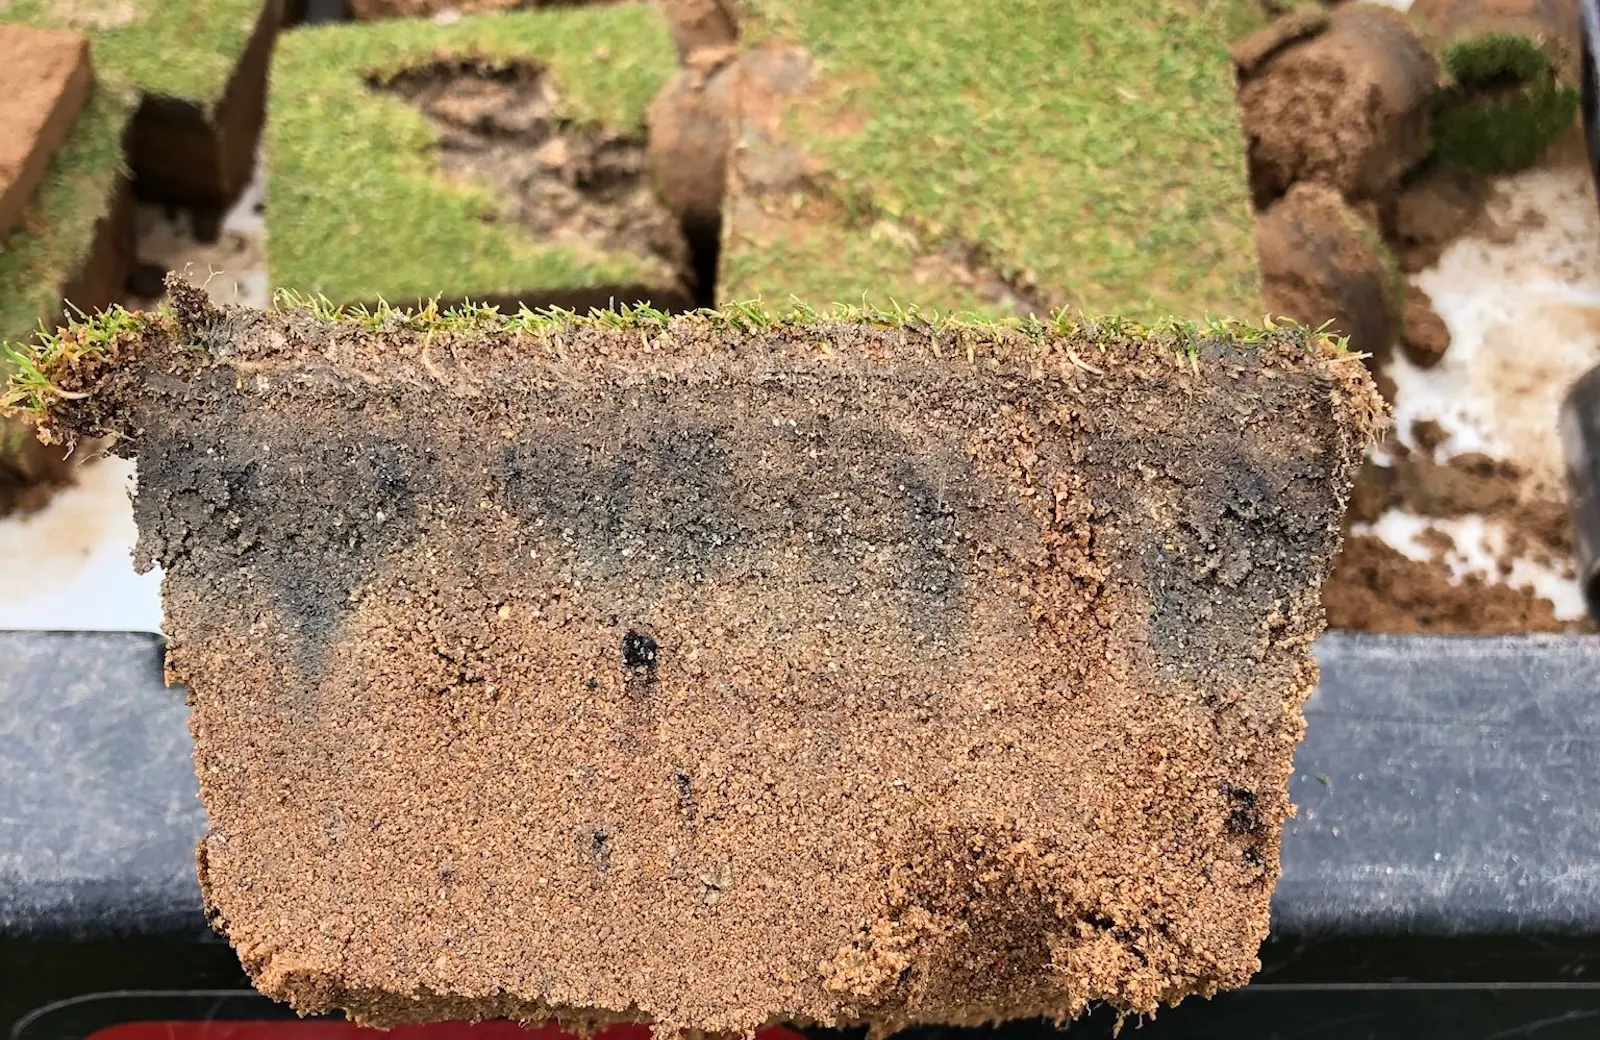
By the time we started testing, the greens were showing several significant performance issues. Infiltration was extremely slow, with water beginning to pool on the surface after only a few minutes of irrigation. During winter, the surfaces became very soft and deep footprints were easily visible across the greens. Pitch marks were large and root development was also relatively shallow.
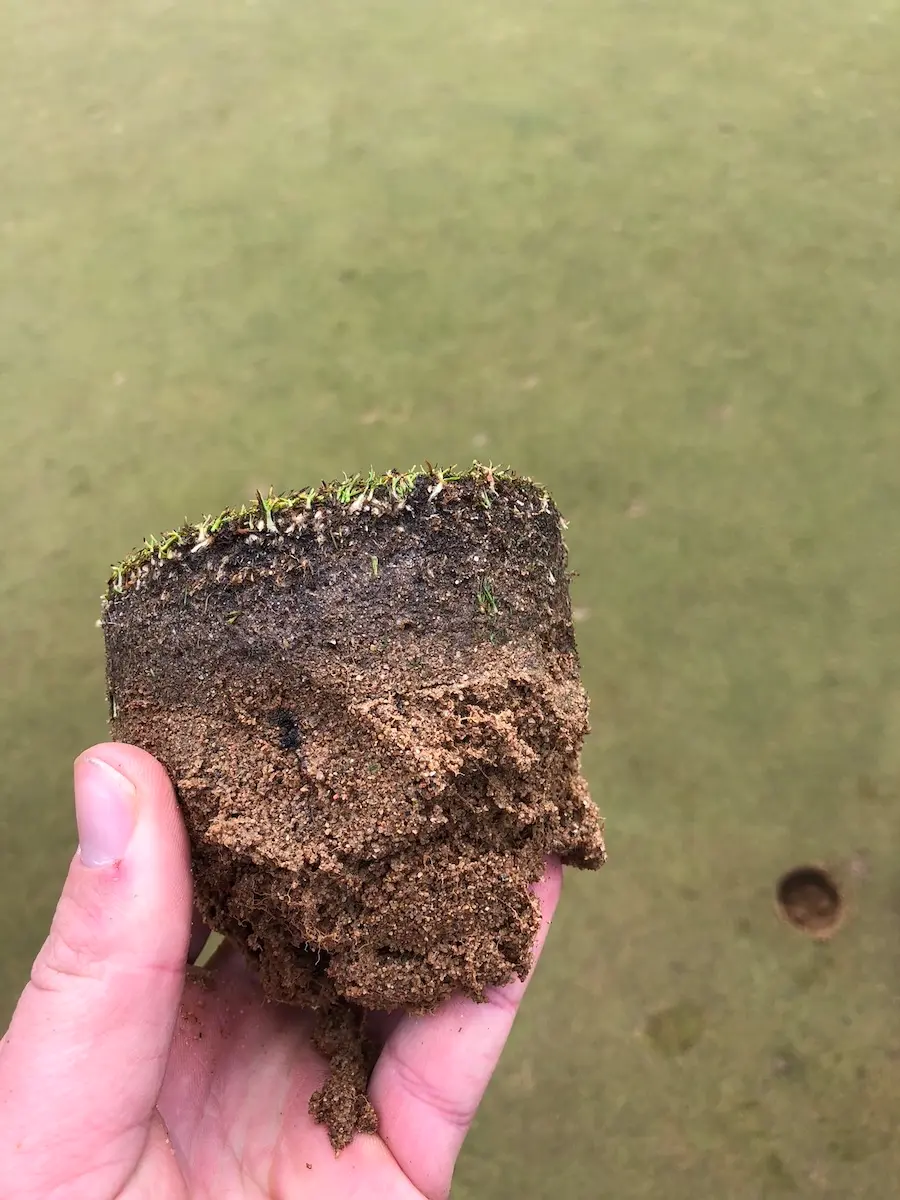
We completed a soil moisture curve analysis on the original construction material and OM246 testing at the surface. The testing showed that the original sand was outside USGA recommendations and had a Coefficient of Uniformity above 6. The material had provided the stability that was originally intended, but this had come at the expense of drainage, with saturated hydraulic conductivity measuring below 25 mm/hr.
The OM246 results added another part to the story. OM2 was higher than average, but of greater interest was its relationship with OM4. The proportion of total organic material concentrated in the upper 20 mm was higher than I would normally expect in comparison to OM2, indicating that organic material had been accumulating rapidly at the surface. The greens therefore had a relatively slow-draining construction rootzone combined with increasing organic matter accumulation in the portion of the profile most important for water entry from the surface.
In this situation, it would have been easy to look at the OM246 result and conclude that excessive organic matter was the cause of the problem. It was certainly contributing, but reducing organic matter alone would not change the underlying characteristics of the original construction material. We also identified higher than required nitrogen inputs as a likely contributor to the rapid rate of new organic matter production.
Before changing the topdressing programme, I recommended testing the other locally available sands using the same soil moisture curve analysis and particle size distribution testing. We selected a suitable USGA specification sand with a considerably higher hydraulic conductivity than the original construction material, which could gradually improve the physical characteristics of the managed rootzone as it was incorporated over time.
The cultivation programme was also changed. One annual core aeration was completed at relatively tight spacing to approximately 100 mm depth, sometimes in more than one direction depending on the time available, while a second core aeration was taken as deep through the profile as practically possible. This allowed us to dilute the accumulating surface organic matter while incorporating the new sand deeper into the profile and creating channels through the slower-draining construction rootzone. Nitrogen inputs were reduced at the same time to slow the rate of new organic matter accumulation while the topdressing programme was gradually adjusted towards the desired OM246 target.
After several years, the response was measurable both in the laboratory and on the greens. Infiltration rates increased, the surfaces became firmer and the deep footprints that had previously been common through winter were no longer visible. Turf health and root development also improved. Testing has continued each year so that the programme can be adjusted if the rootzone begins moving away from the performance targets again.
The important point from this example is that the recommendation wasn't simply to increase aeration because infiltration was low or because organic matter was high. The original construction material, the rate of organic matter accumulation and the characteristics of the available topdressing sands all needed to be considered before deciding how the rootzone could realistically be improved.
When Faster Drainage Is Not the Target
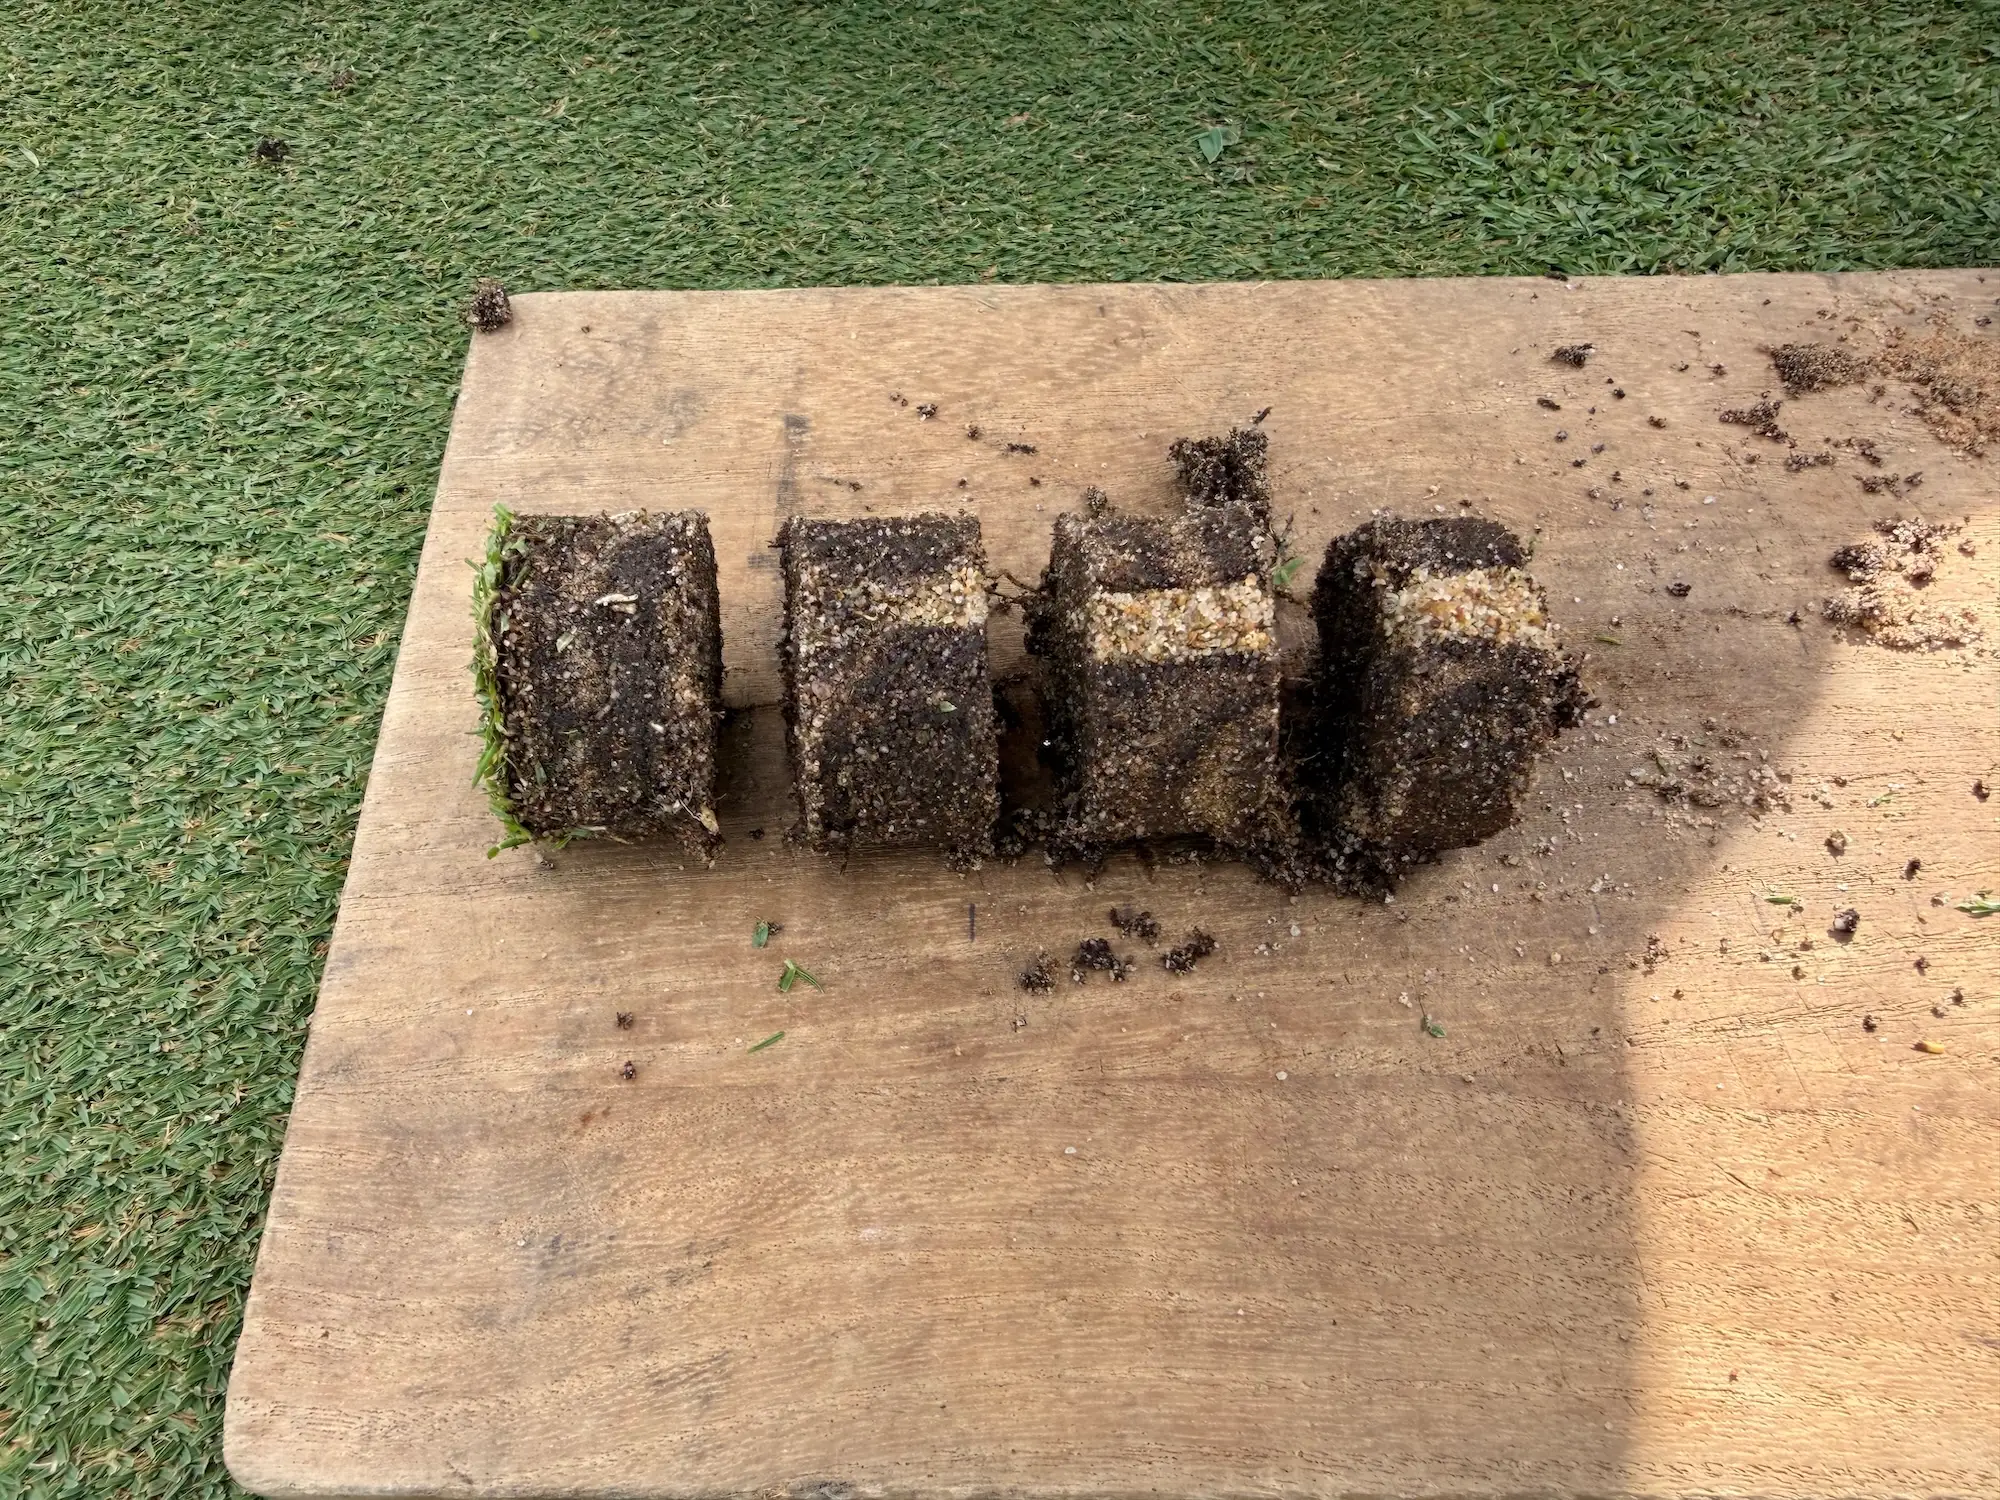
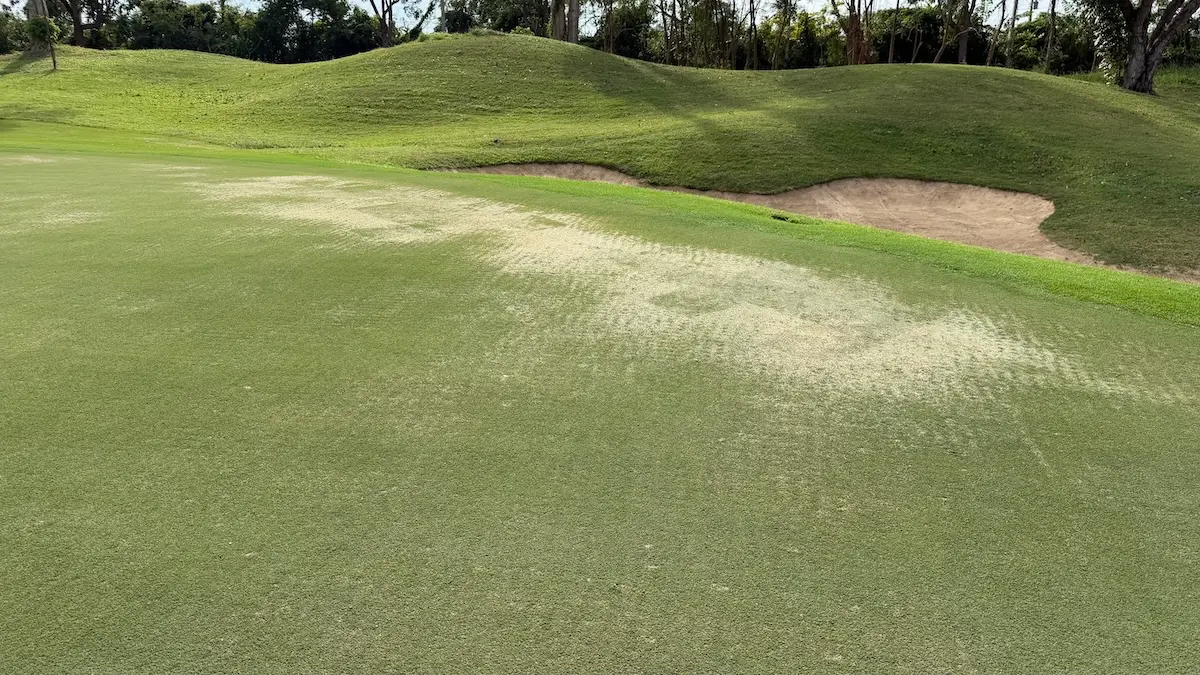
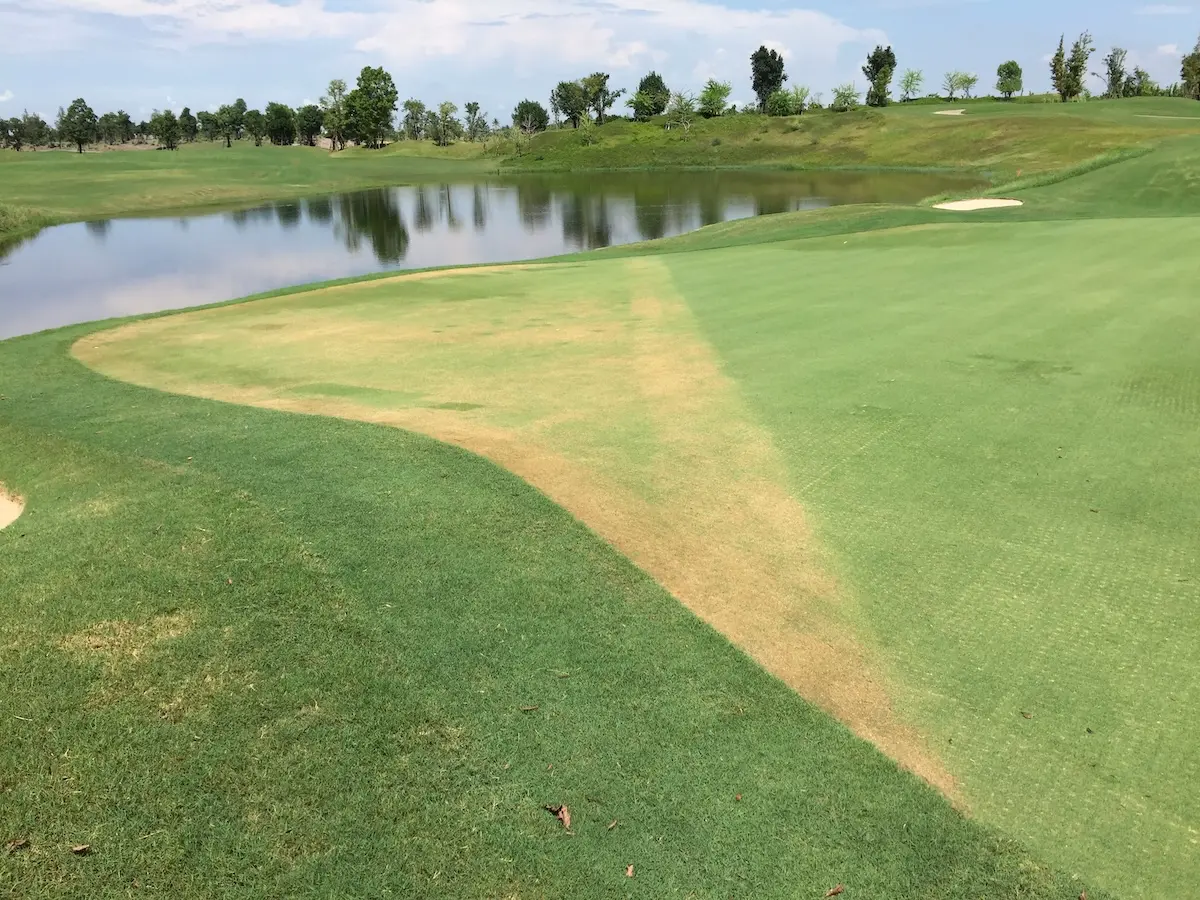
At another golf course in tropical Southeast Asia, we had almost the opposite problem. Sections of several greens were yellowing, with very distinct straight lines separating yellow turf from healthy turf immediately beside it. The rootzones also dried very quickly and often required hand watering several times during the day. Maintenance equipment could easily leave wheel tracks across the surfaces.
Field infiltration testing confirmed that water was moving through the upper profile extremely quickly. Soil moisture curve analysis was then completed on both the topdressing sand and the original construction material to understand what was happening within the profile.
The topdressing sand met USGA recommendations but had a saturated hydraulic conductivity above 1,000 mm/hr. Approximately 130 mm below the surface, the original construction rootzone was very different, with saturated hydraulic conductivity below 100 mm/hr, a higher percentage of fine particles and air-filled porosity below 11%.
The difference between the two materials became even more important when we investigated the sections of turf that were yellowing. Parts of several greens had previously been reconstructed entirely using the highly permeable topdressing sand rather than the original construction material. The boundaries of those reconstructed areas corresponded closely with the straight lines visible between the yellow and healthy turf.
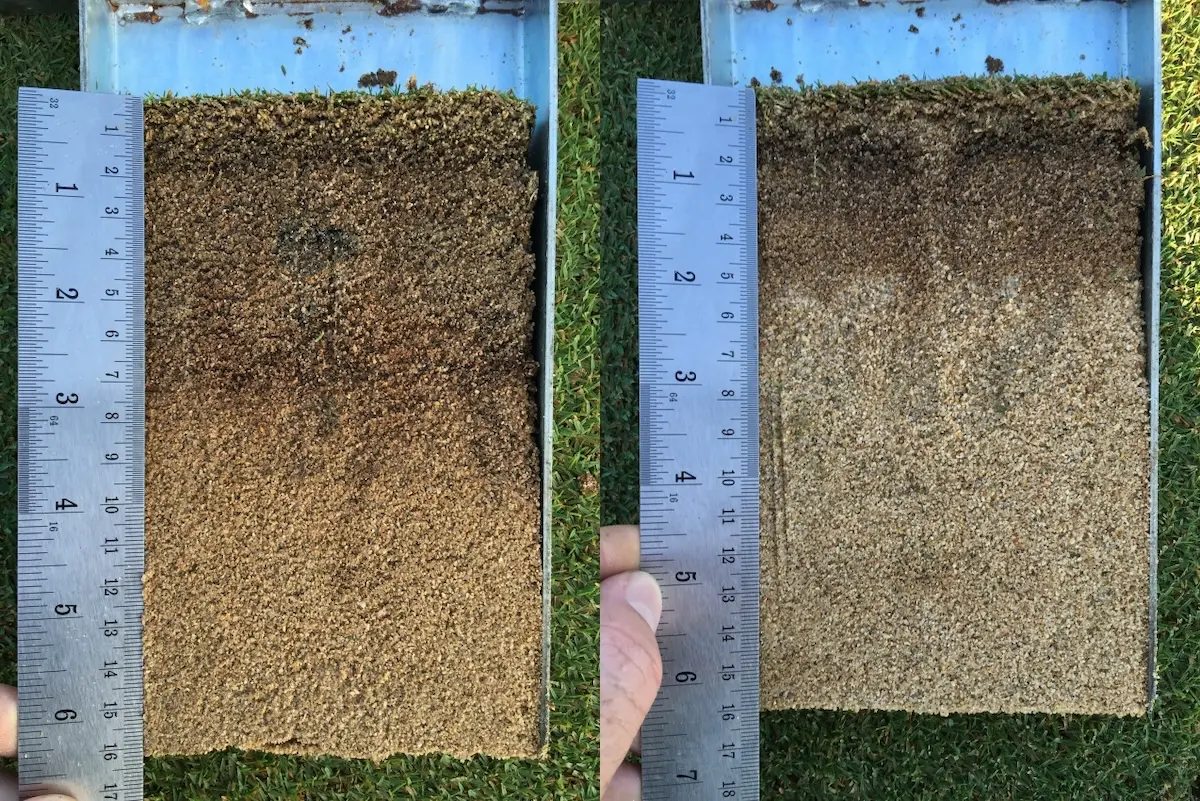
The affected turf responded well following fertiliser applications, but the improvement did not last. Nutrients and water were moving through those areas much faster than through the adjoining original rootzone, which helped explain why two sections of the same green could behave so differently despite receiving exactly the same maintenance.
The particle characteristics also helped explain why the surfaces were relatively unstable under maintenance traffic. The topdressing sand had a Coefficient of Uniformity of 2.29 and slightly rounder particles, compared with a CU of 3.45 and more angular particles in the original construction material. The highly uniform sand provided excellent drainage but less particle interlocking and stability, which was consistent with the wheel tracking we were seeing.
If we had simply looked at the hydraulic conductivity result in isolation, it would have been very easy to view the extremely high infiltration rate as a positive characteristic. In practice, however, these greens were struggling to retain enough moisture and nutrients and parts of the profile were also less stable than we wanted.
I recommended selecting another USGA specification sand with saturated hydraulic conductivity closer to 500 mm/hr for use during aeration events. This still provided more than adequate drainage while allowing us to gradually move the managed rootzone towards a better balance between drainage, moisture retention and stability. The existing higher-infiltrating sand could continue to be used for lighter surface topdressing where its ability to dilute organic matter remained useful.
The OM246 results were also slightly below the average benchmarks we were using at the time. Rather than trying to reduce organic matter further, I advised allowing levels to increase slowly towards the benchmark range. In this particular rootzone, a modest increase in organic matter would help improve moisture and nutrient retention and increase the relatively low cation exchange capacity of the very sandy profile.
Over the following years, the greens became considerably more uniform in both appearance and performance. The improvements were supported by subsequent laboratory testing as well as field measurements across the greens.
This is a good example of why I don't believe we should automatically chase the highest possible infiltration rate or the lowest possible total organic material percentage. Both are useful measurements, but improving either one beyond what the rootzone requires can begin to compromise another characteristic that is equally important to turf or playing performance.

Sometimes the Rootzone Only Explains Part of the Problem
Testing can also be valuable when it shows us that the rootzone is unlikely to be the main reason for a problem.
At another golf course in tropical Southeast Asia, a small number of greens were suffering frequent and severe disease outbreaks during the wet season. OM246 testing showed that total organic material levels were higher than desired, while nutrition and soil moisture were being maintained within the required ranges and the preventative fungicide programme was already strong.
At first glance, the elevated organic matter provided an obvious explanation for the disease pressure. The problem with that conclusion was that the other greens across the golf course had approximately the same OM246 levels and were not experiencing anything close to the same level of disease damage.
That immediately suggested we needed to look beyond the soil test. When we compared the affected greens with the rest of the course, the biggest difference was the surrounding environment. Each of the problem greens had very poor air movement and was enclosed by dense native jungle, undergrowth and invasive tree species. During prolonged periods of wet weather, there was very little opportunity for the turf canopy and surface to dry, creating an environment where disease could remain active despite an otherwise strong management programme.
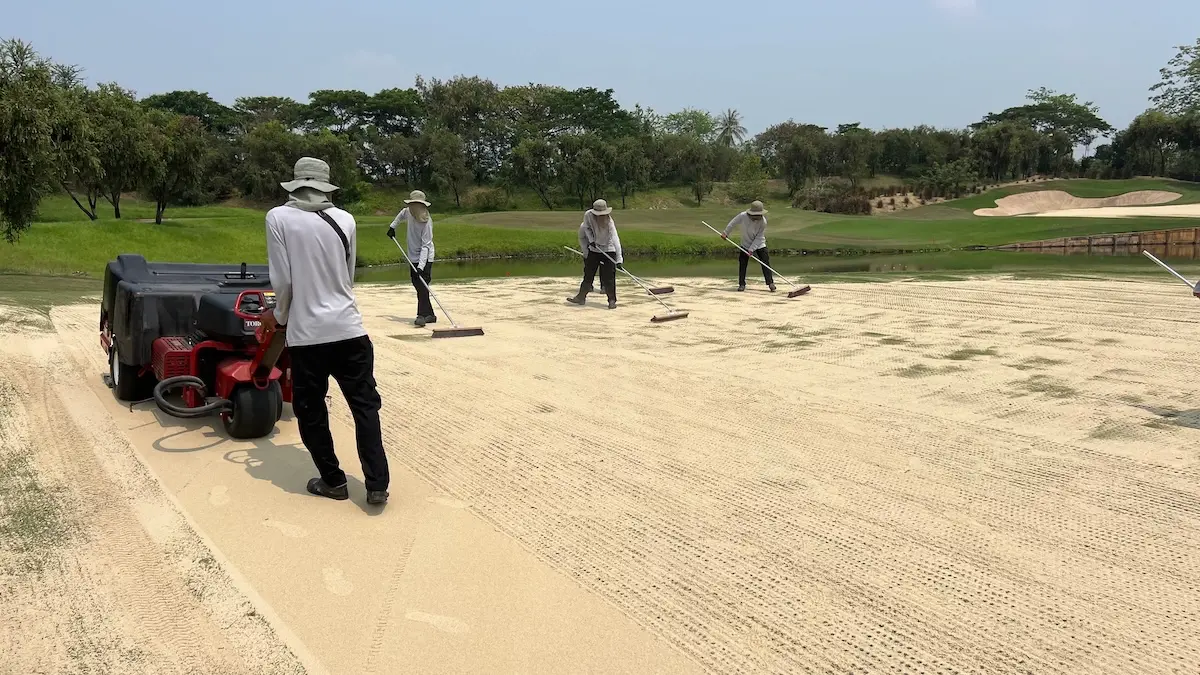
The elevated organic matter still needed to be addressed, so I recommended a more aggressive reduction programme involving aeration, scarification and increased sand topdressing until levels returned towards the median benchmark range. At the same time, undergrowth was cleared and selected vegetation was removed or heavily trimmed around the affected greens to substantially increase air movement across the putting surfaces. An additional benefit of this work was reopening views across parts of the golf course that had not been visible since the course was originally constructed.
The affected greens improved dramatically during subsequent wet seasons, with minimal or no disease damage compared with the severe outbreaks experienced previously. Organic matter had been part of the management issue and still warranted correction, but it could not explain why only a few greens were consistently failing while other greens with similar OM246 results remained healthy.
This is an important use of testing that is sometimes overlooked. The purpose is not always to identify something within the rootzone that needs to be fixed. Sometimes the data allows us to rule out a suspected cause and look elsewhere for the factor that is actually limiting performance.
Turning Results Into a Maintenance Decision
These examples are very different, but the way I approach the results is relatively consistent. I want to understand what we are seeing in the field, whether the laboratory results can explain that behaviour and whether there is a practical management change capable of moving the rootzone in the desired direction.
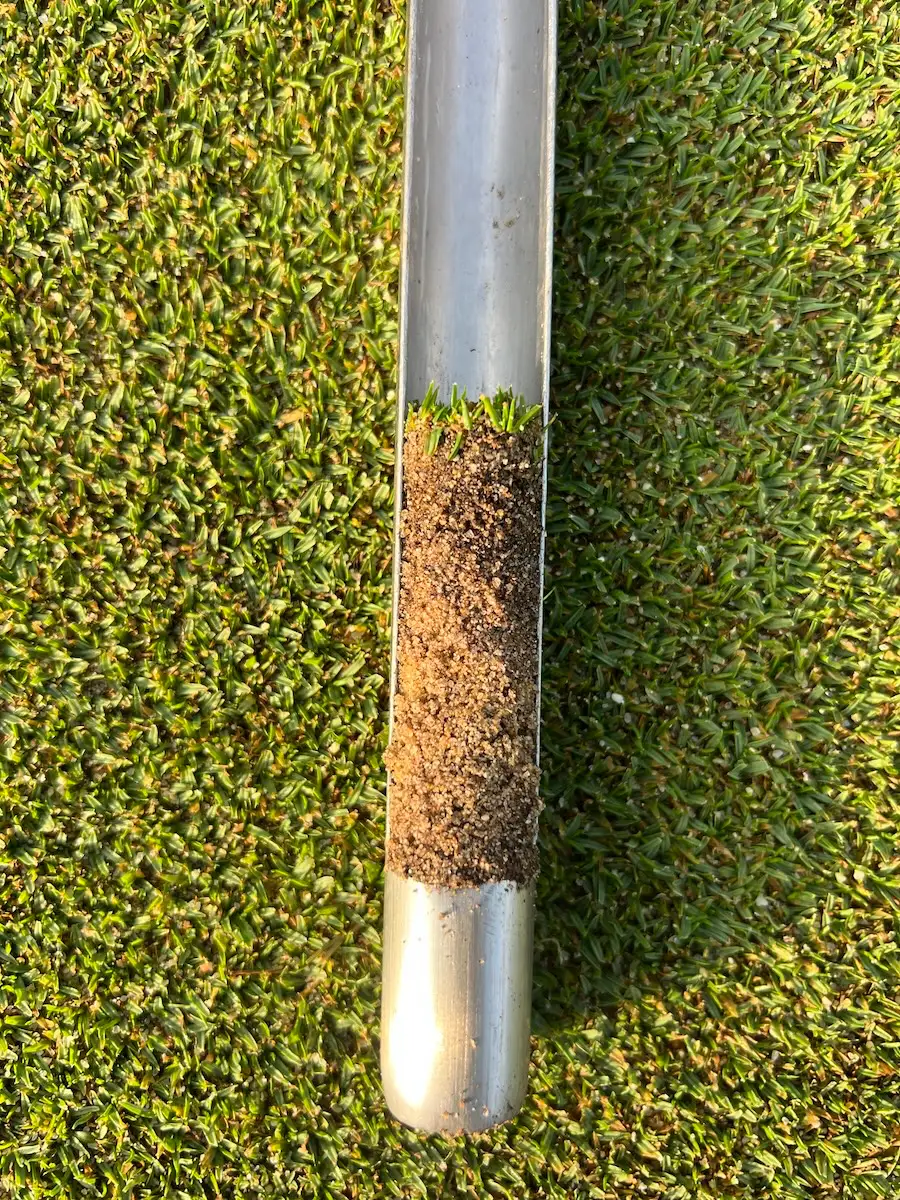
The entire profile also needs to be considered rather than focusing only on the current topdressing layer. Putting greens continue to change from the day they are constructed. Organic matter accumulates, different topdressing sands influence the particle distribution of the managed rootzone and repeated traffic or cultivation can alter pore space and layering. After many years of management, the physical characteristics close to the surface can be very different from the construction material underneath.
This is why the same headline result can lead to completely different recommendations. Low hydraulic conductivity caused partly by a slow-draining construction sand requires a different strategy from declining infiltration caused predominantly by excessive surface organic matter. Likewise, extremely high hydraulic conductivity may look good on a laboratory report until the greens are drying too quickly and nutrients are continually being lost from the profile.
Before changing a maintenance programme, I want to be reasonably confident that the result is connected to something we are trying to improve. I also want to know what effect I expect the proposed maintenance practice to have. If we increase sand topdressing, for example, there should be a measurable objective for how we want OM246 or the managed sand fractions to change over time. If we select a different sand, its physical characteristics should be chosen because they move the rootzone towards the required performance rather than simply because the material meets a specification.
The same principle applies to cultivation. Coring deeper, using tighter spacing or increasing renovation frequency may all be appropriate in certain situations, but the practice itself is not the objective. We need to understand what part of the profile we are trying to change and why that change should improve the performance of the green.
Measure What Happens Next
Once a maintenance programme has been changed, the next step is to continue testing and determine whether it actually worked. This is where repeat testing becomes considerably more useful than a single laboratory report.
If nitrogen inputs were reduced to slow organic matter accumulation, the rate of change in OM2 should eventually reflect that. If a different sand is being incorporated through aeration, changes in particle size distribution and physical performance should become measurable over time. Where infiltration or moisture retention was the original concern, those measurements can be repeated alongside the normal field performance testing to determine whether the greens are actually moving towards the desired condition.
Not every response will occur quickly and not every recommendation will produce exactly the change expected. Putting greens are dynamic systems and the effects of gradually modifying a rootzone can take several years to become clear. That does not reduce the value of testing; it is the reason long-term monitoring is so important.
Rootzone Performance Testing and Soil Nutrient Testing should therefore be viewed as much more than a one-off investigation. The initial results establish where the rootzone is today, the management programme is designed around where we want it to go, and repeat testing tells us whether we are getting there.
Final Thoughts
There is no single laboratory number that defines a high-performing rootzone. A very high infiltration rate can be just as problematic as one that is too low, while an organic matter result that requires action at one golf course may be perfectly acceptable at another.
The value of Rootzone Performance Testing comes from putting those numbers into context. We need to connect the results with what we are seeing on the golf course, understand which characteristics are limiting performance and then make changes that have a clear purpose.
Sometimes that may mean increasing cultivation or changing the sand being incorporated into the profile. In other situations, the most useful outcome from the testing may be confirmation that the main problem sits somewhere else entirely.
Either way, the laboratory report is only the beginning. The real benefit comes from using the information to make a better decision and then measuring whether that decision actually improved the performance of the green.